Ever tried to debug an AI application and felt like you’re navigating a maze?
The complexity only grows when you’re dealing with workflows that use multiple tools, handle conditional logic, and loop back on themselves. Vellum’s latest release simplifies this process with two powerful new views:
1/ Trace Span for tracking each step’s execution, timing and costs, and
2/ Graph View for a clear, visual map of your workflow’s entire structure and decision points.
Let’s go into more details.
The Basics of Debugging AI Workflows
Let’s take a familiar example: asking, “What’s the weather in X city?”
A function call fetches the answer, and it seems straightforward—until you need to understand the AI’s step-by-step process. A high-level overview won’t reveal the flow and timing of each action, and you often need more visibility to fully grasp how each decision unfolds and the details behind it.
With Vellum’s latest updates, you get a clear view into the inner workings of your workflow, letting you understand each step, decision, and configuration with ease.
New Trace span view
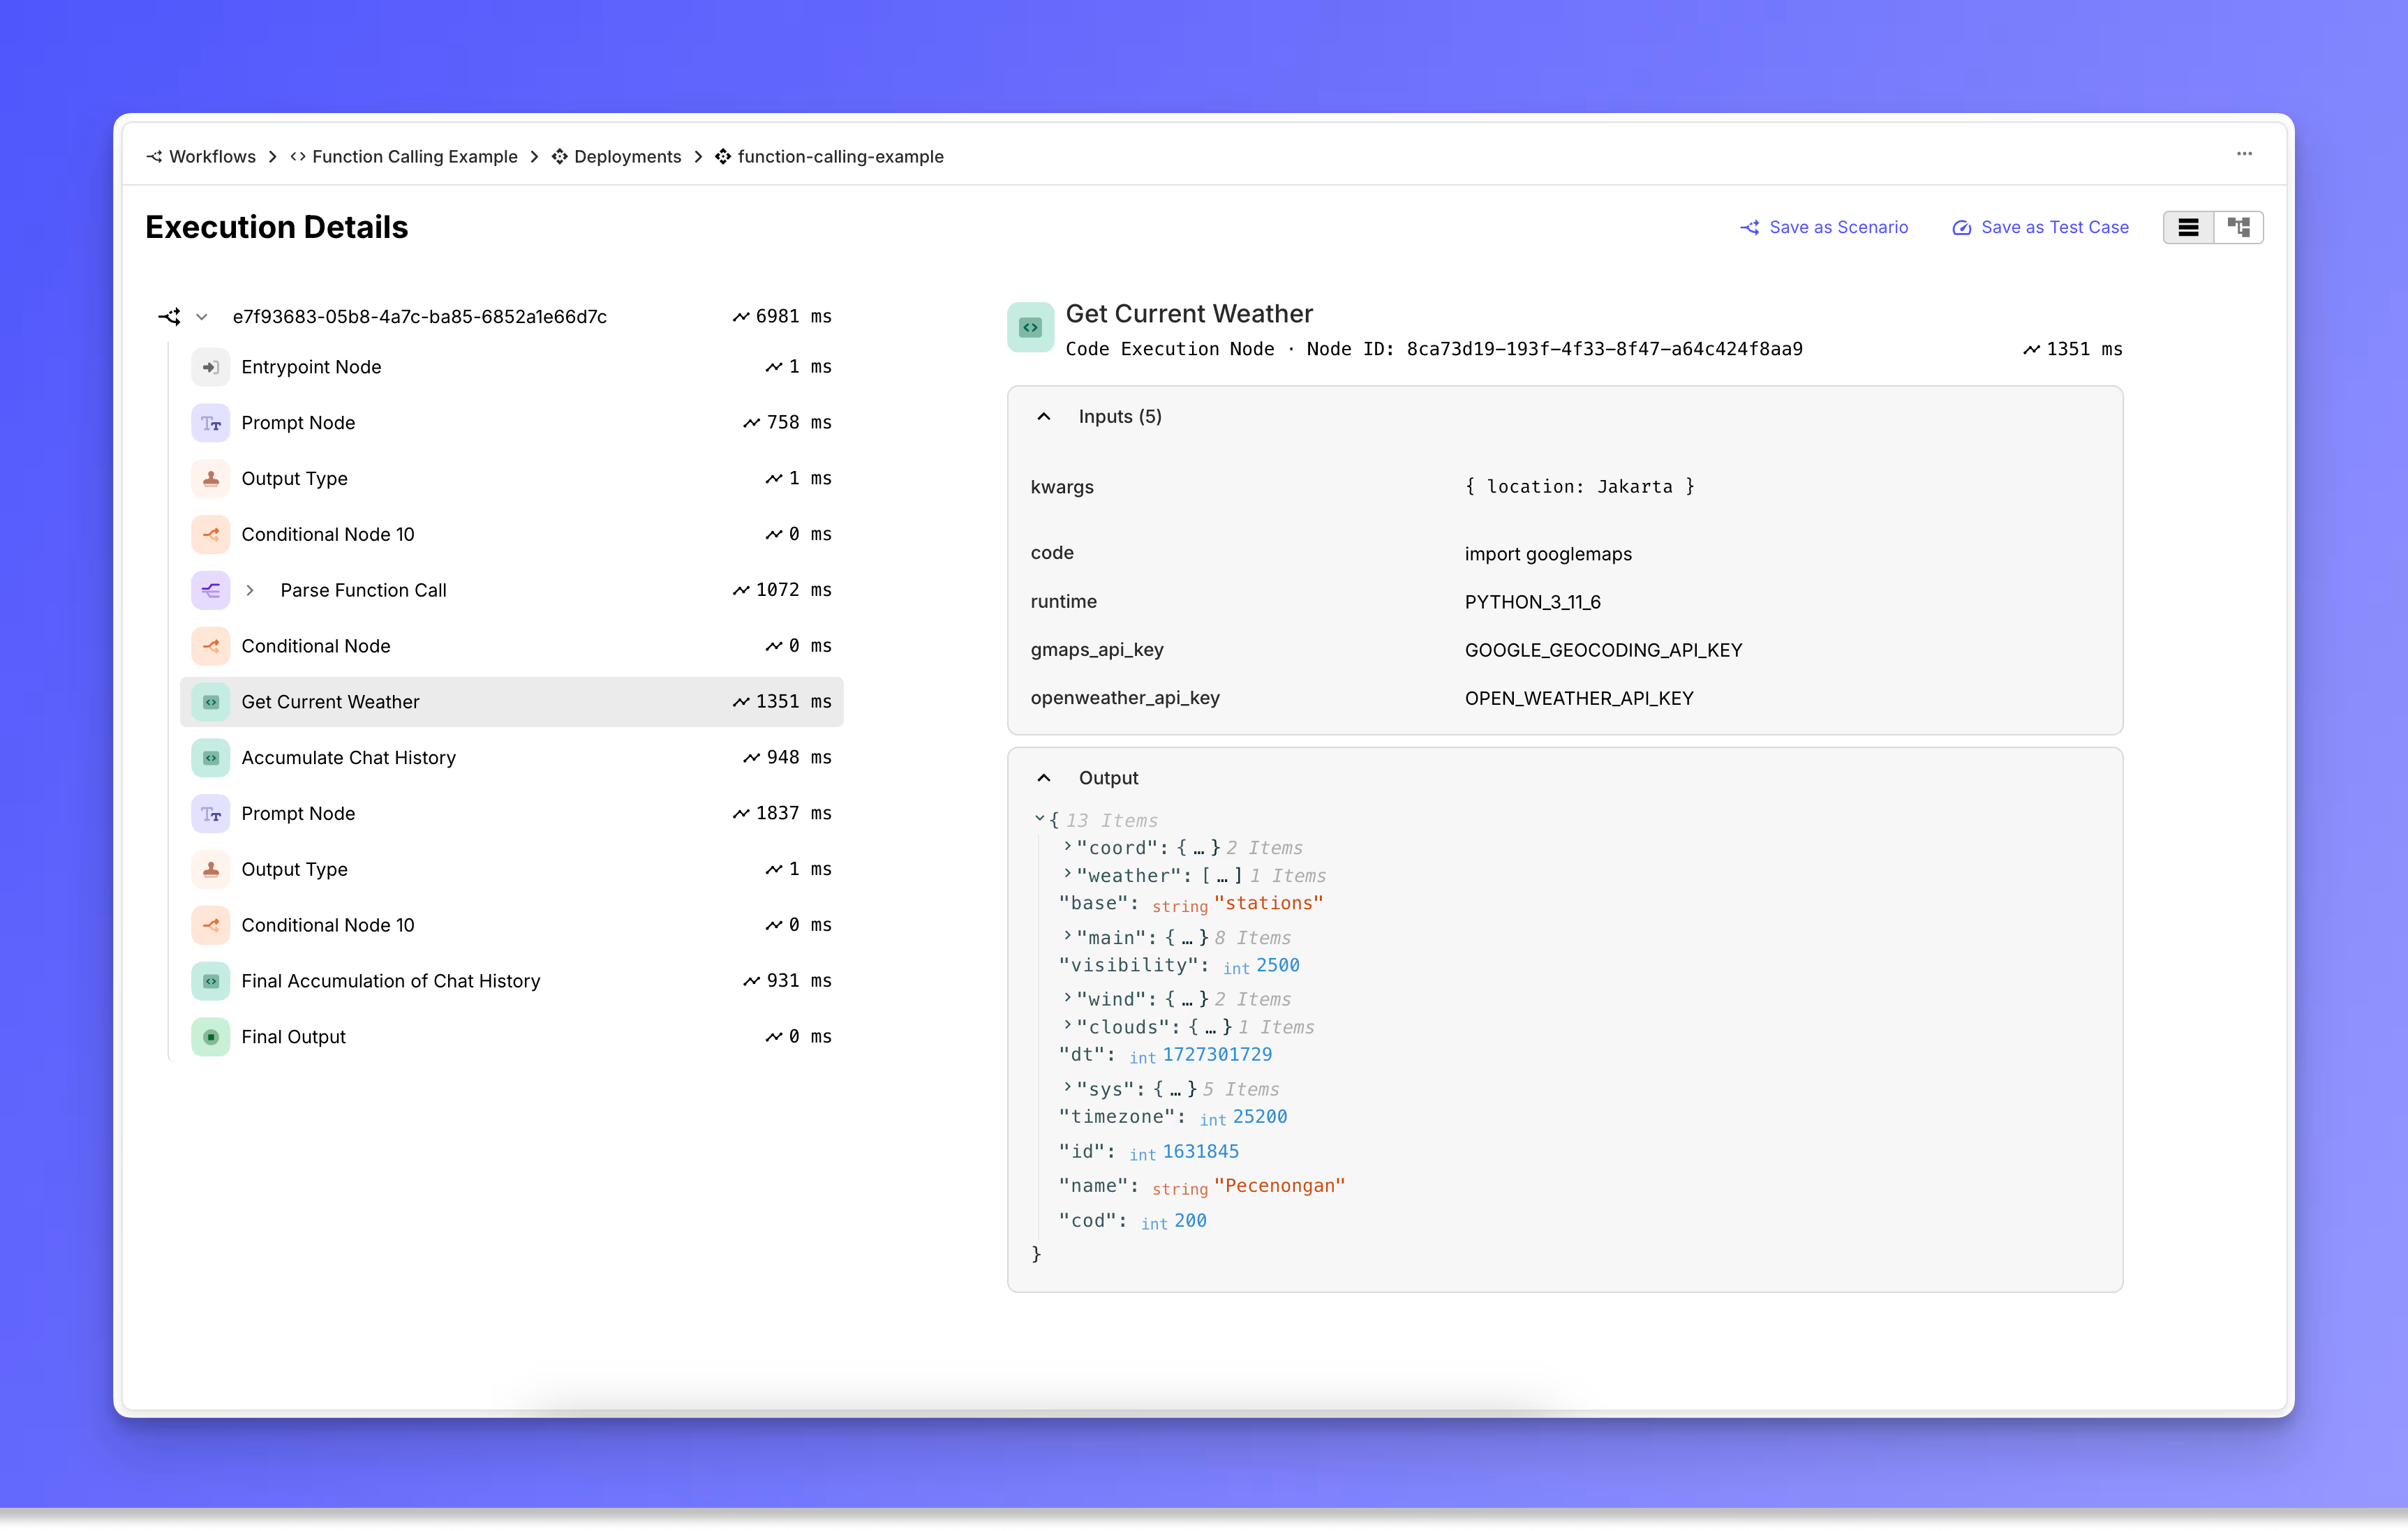
With Vellum, each API request in your workflow shows up in the trace span view . Think of this a breakdown of every action your workflow took in chronological order. With this view you can:
1/ View details for each step, and intrasteps within SubWorkflows (AI primitives)
The tracing view lets you quickly see latency and configuration details for each workflow step. If your workflow includes SubWorkflows as AI primitives, you can view overall latency or dive into individual steps to analyze their configurations. Watch a quick demo here .

2/ Preview execution details for each Prompt Node
In the tracing view, you can expand each Prompt Node’s execution details to see prompt configurations, along with the raw input and output data from each model provider.

Think of it like application performance monitoring (APM) but tuned for AI—capturing everything from input to output so you can see exactly what’s happening at each step.
Let us know if you want to try it.
For the visual learners, we have something even better!
New Graph view for debugging
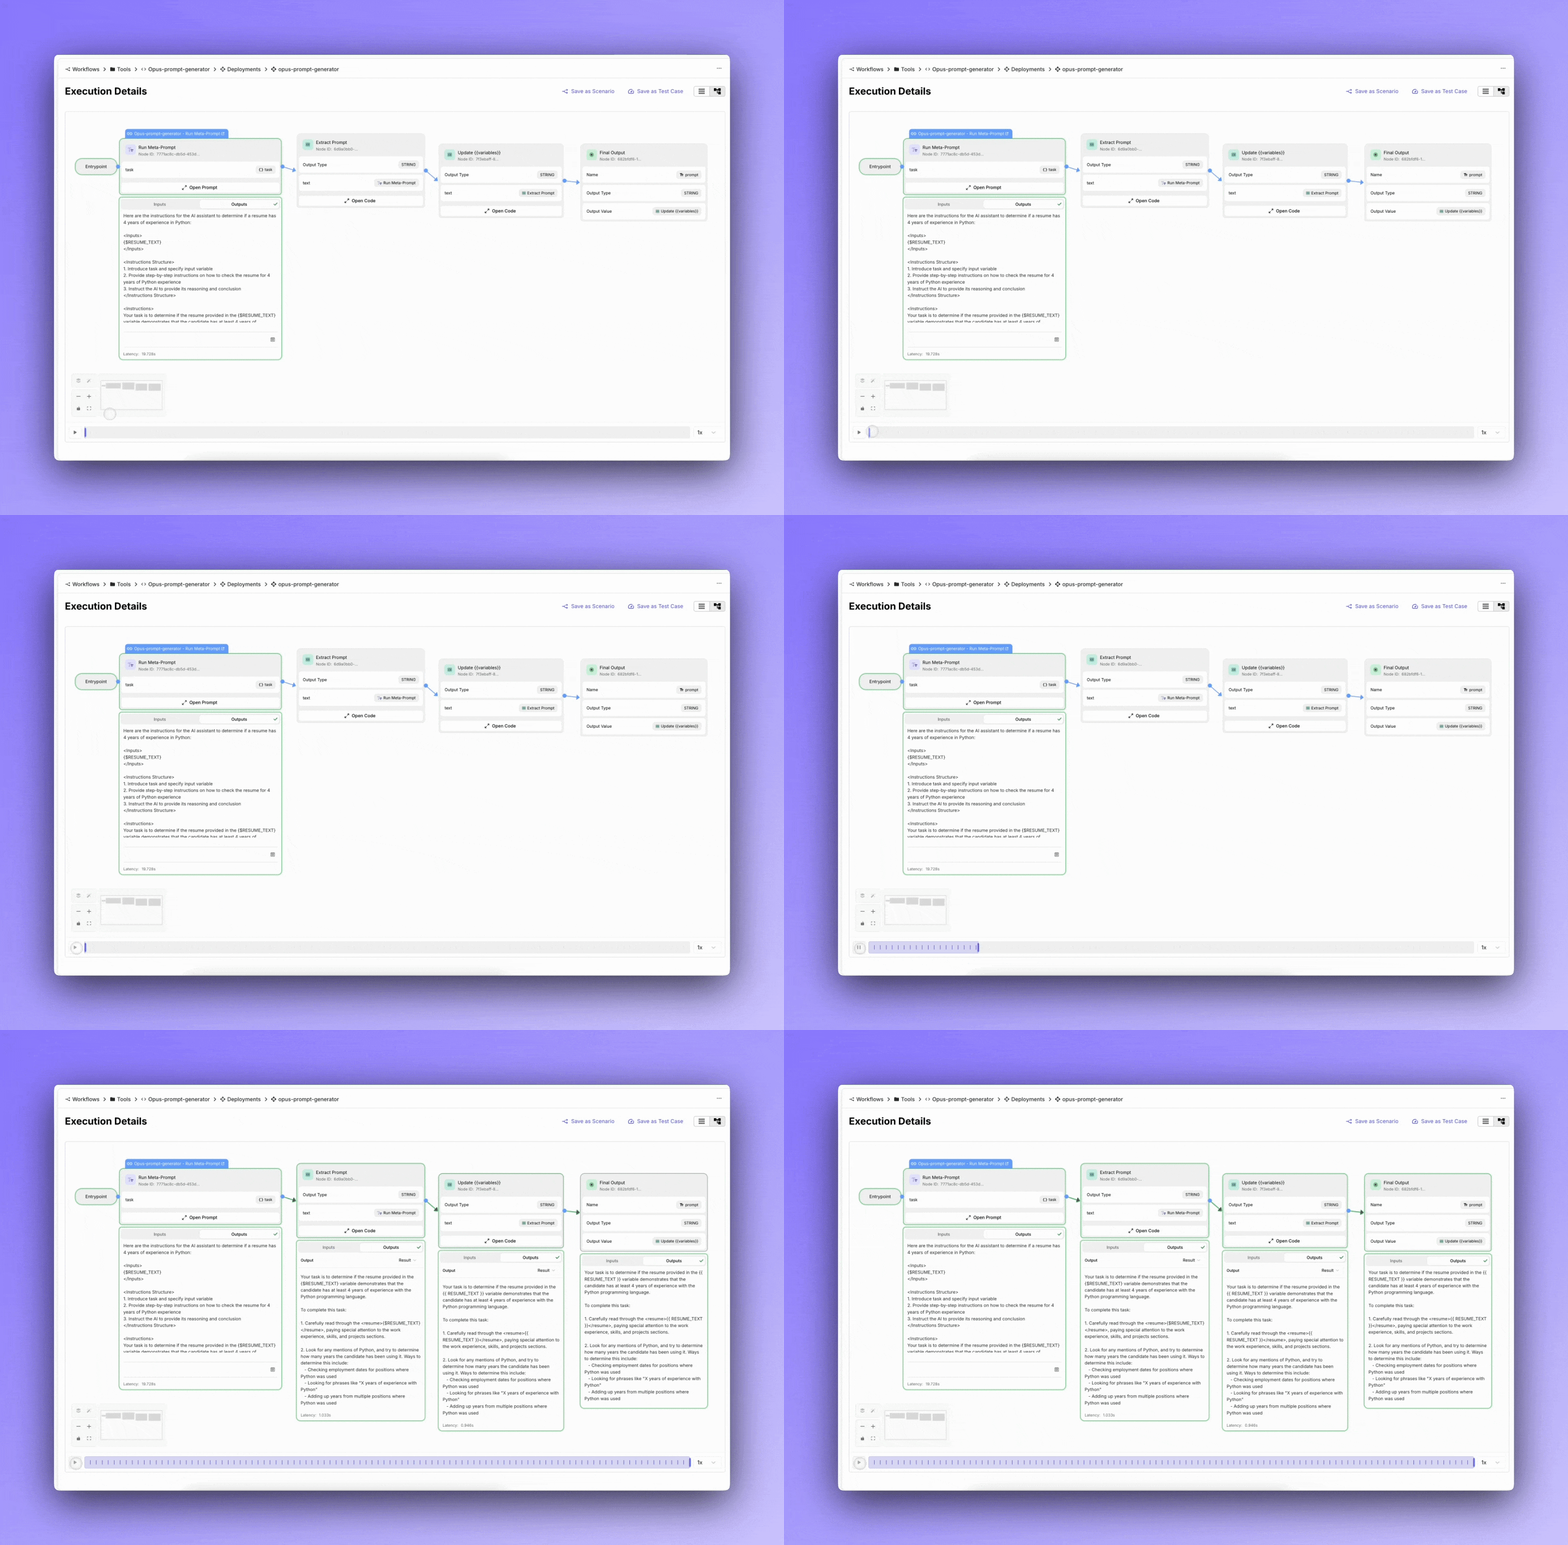
Where Vellum really shines is in its unique graph view .

Trace span views while useful, aren’t particularly novel. Many vendors in the LLM Ops space offers this table stakes feature and the concept has been around for a long time in the world of APM tooling. Where this release shines is in its uniquely Vellum graph view. With Graph View, you can see every detail about what your AI system looked like at the time of an execution, and replay to see exactly what path it took and each decision that was made.
It’s a powerful way to visualize the control flow of your AI systems.
For workflows with loops, it’s a game-changer: you’ll see how it loops, where it starts, and where it goes each time it repeats, making debugging far clearer than in traditional views.
So many of our customers say that this is the best way to debug your apps.
Why should all this matter to you
The trace span view lets you measure timing, find bottlenecks, and, soon, even calculate costs at each step. Meanwhile, the graph view gives you the full picture—what happened, what could have happened, and how everything connects.
Together, these tools offer a robust debugging experience that’s tailored for the complex, layered nature of AI workflows.
So next time you’re tracing an error, optimizing a loop, or just curious about how your AI app is making decisions, Vellum’s trace span and graph views are there to help, offering visibility and clarity in every step.
Let us know if you want to give it a try!