Subworkflow Nodes
As you build out more complex Workflows, you may find that your Workflows are becoming large and difficult to manage. You might have groups of nodes that you want to reuse across multiple Workflows, but until now, there hasn't been an easy way to do this without duplicating the same nodes and logic each time.
Introducing Subworkflow Nodes - a new node type in the Workflows node picker that allows you to directly link to and reuse deployed Workflows within other Workflows!
With Subworkflow Nodes, you can now create composable, modular groups of nodes that can be used across multiple Workflows.
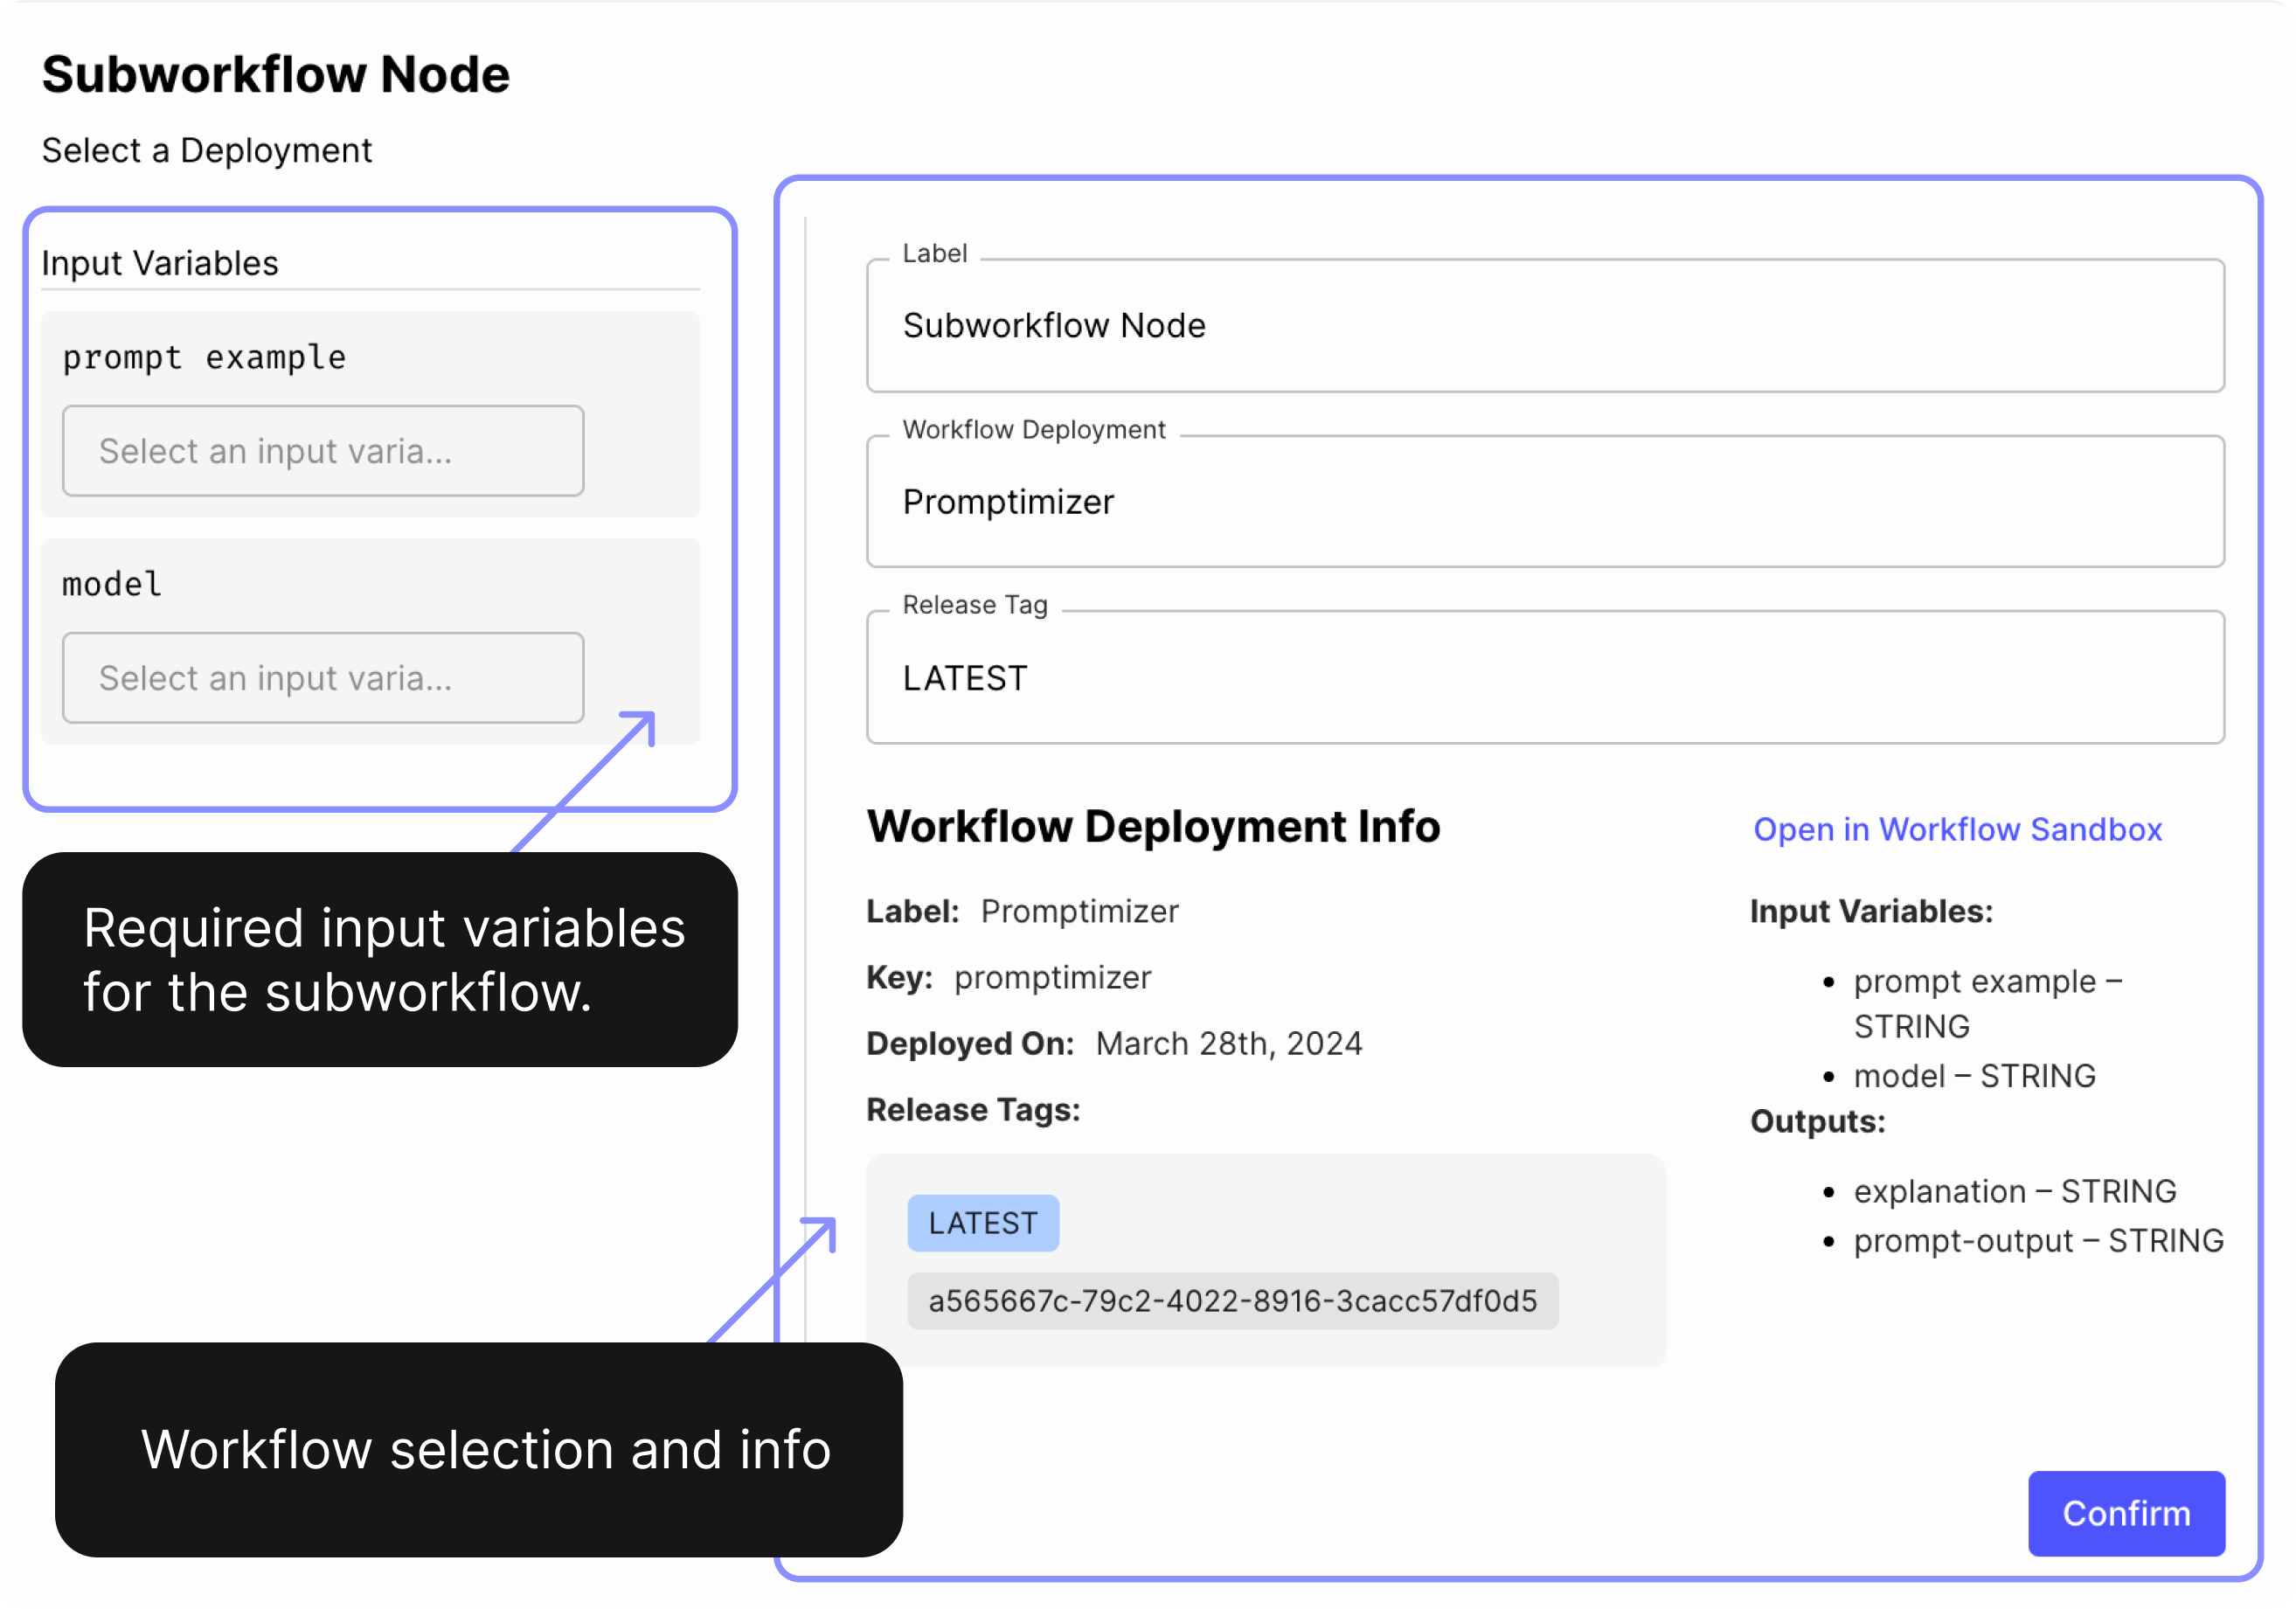
Subworkflow Nodes also supports release tagging, giving you the flexibility to either pin to a specific version (say, PRODUCTION) or always automatically update with LATEST.
Image Support in the UI
You can now leverage the power of multimodal models in your LLM apps.
Vellum supports images for OpenAI’s vision models like GPT-4 Turbo with Vision - both via API and in the Vellum UI.
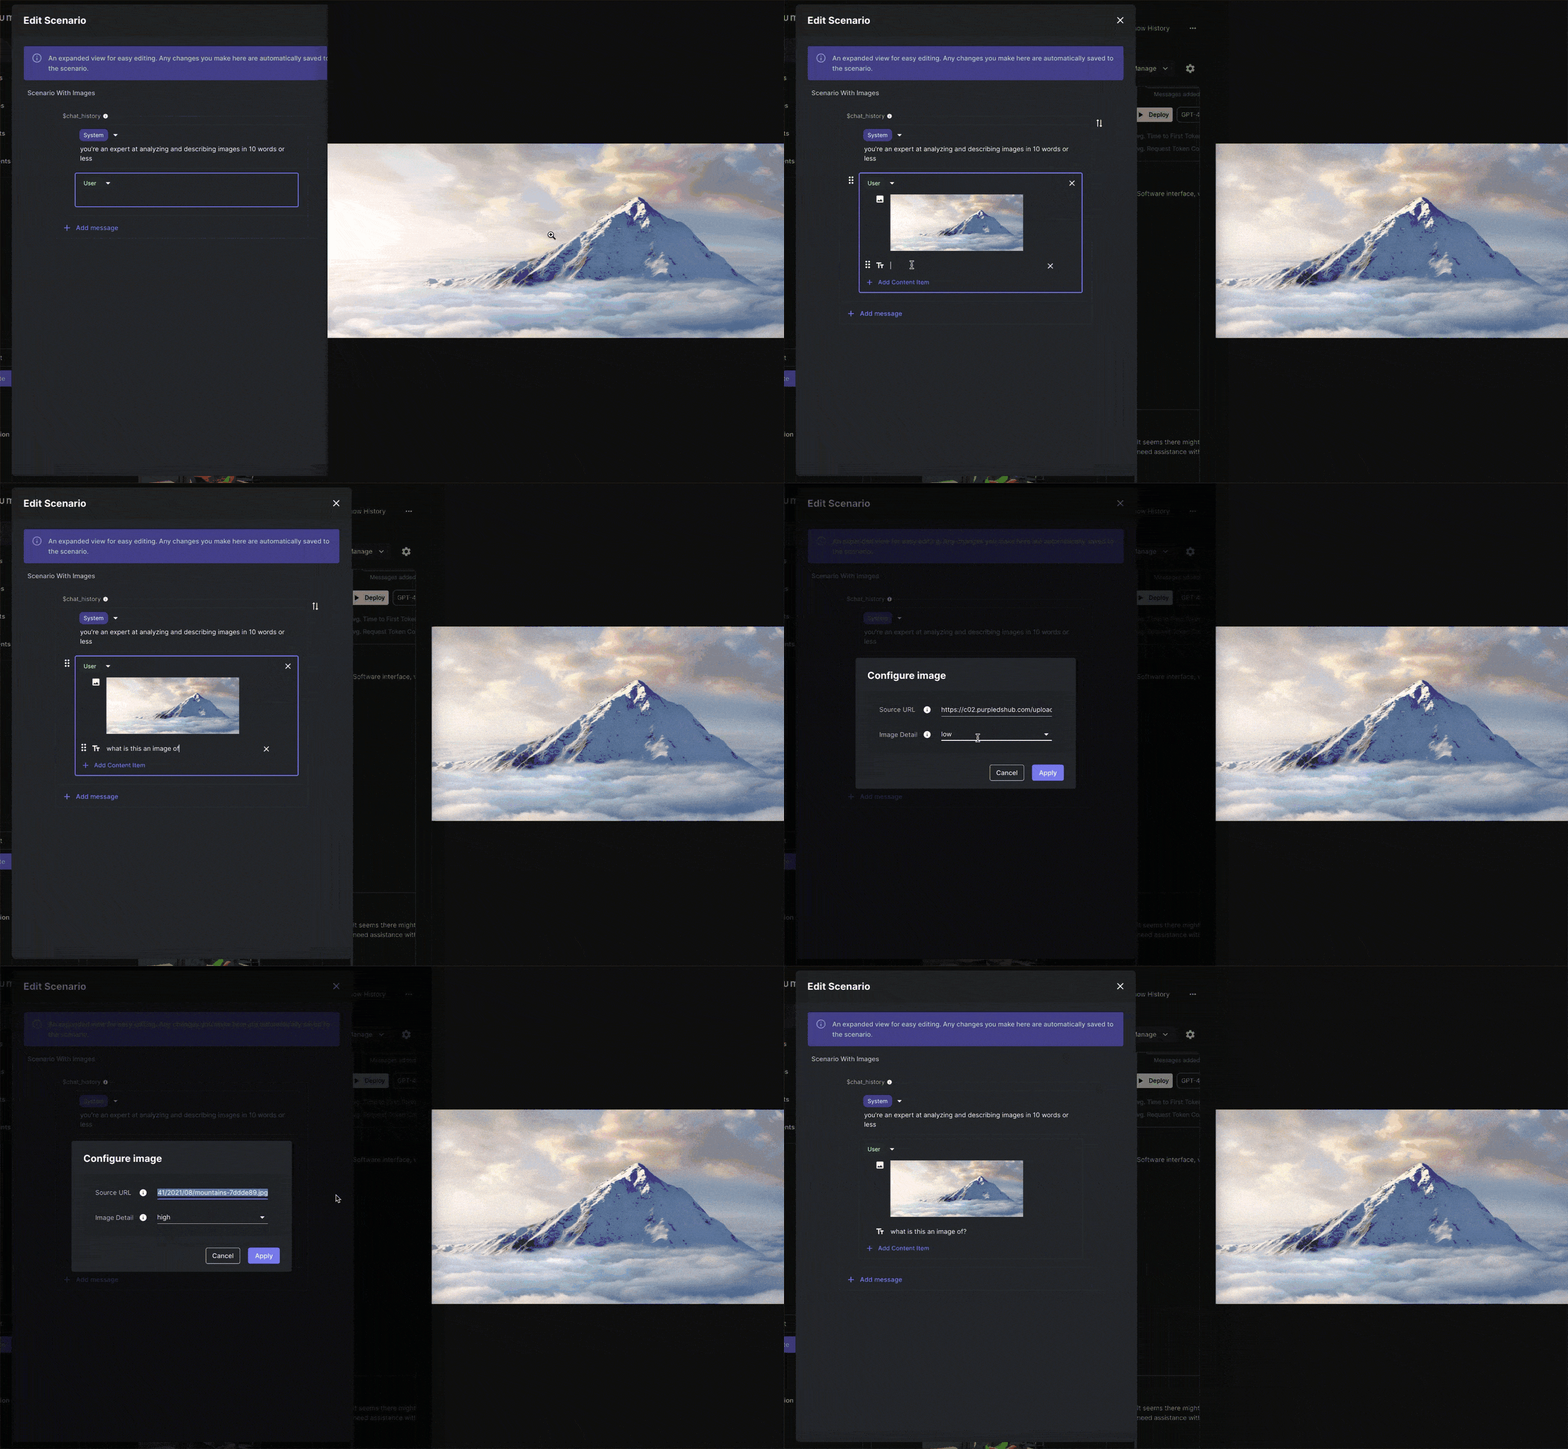
To use images as inputs, you’ll need to add a Chat History variable, choose “GPT-4 with Vision” as your model, and drag images into the messages for both Prompt and Workflow Sandbox scenarios.
📖 Read the official guide on how to start with images on this link.
Workflow Error Nodes
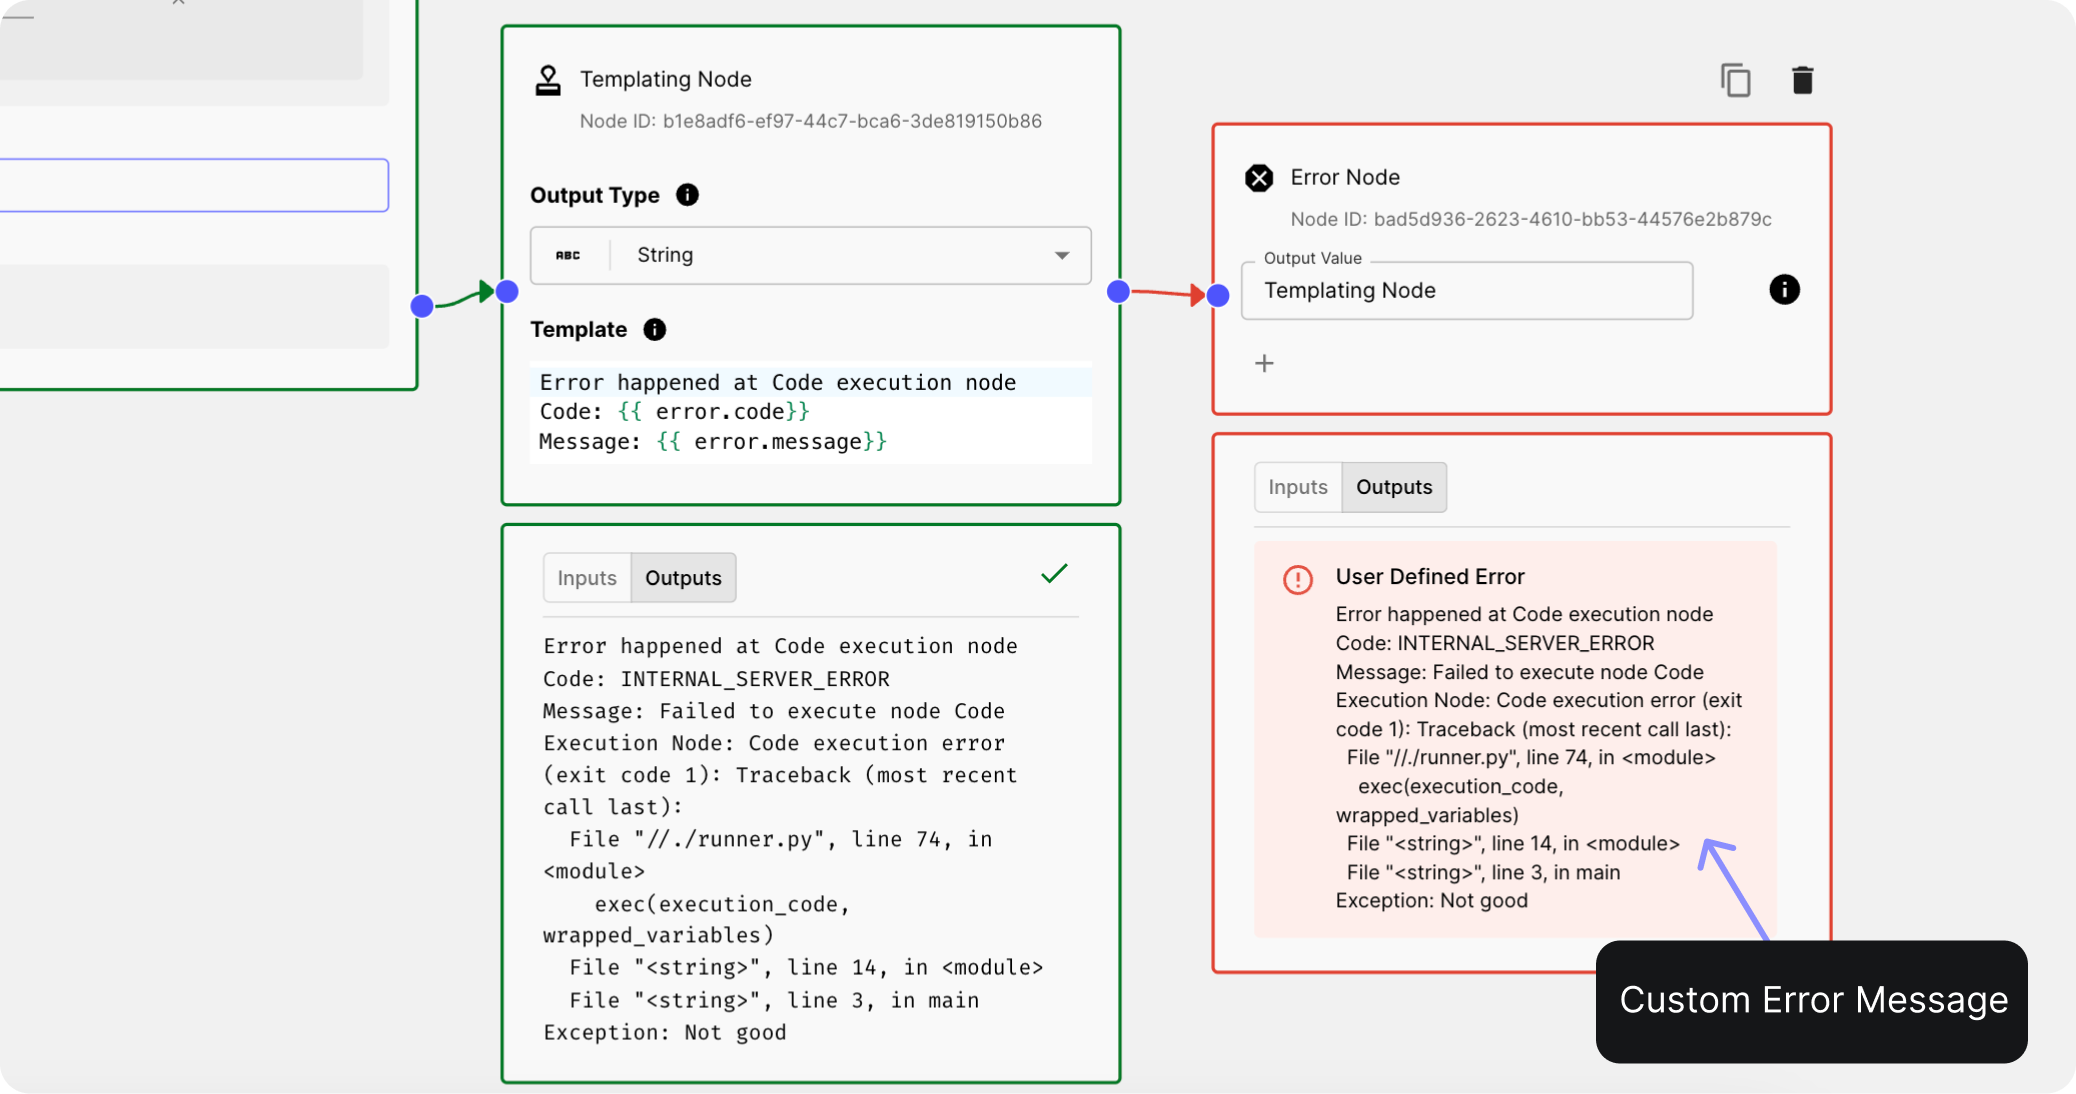
Up until now, if an error occurred in a Workflow node, the entire Workflow would fail and halt execution, but there was no way to handle them or learn what happened.
You can now intentionally terminate a Workflow and raise an error using the new Error Nodes.
With Error Nodes, you have two options:
Re-raise an error from an upstream node, propagating the original error message. Construct and raise a custom error message to provide additional context or a tailored user-facing message.
🎥 Watch how it works here.
Read-Only Workflow Diagrams
Previously, when viewing a Workflow Deployment Execution, you couldn't visually see the workflow diagram associated with that execution. This made it difficult to quickly understand what the workflow looked like at that point in time and visualize the path the execution took.
You can now access a read-only view of the workflow diagram for Workflow Deployment Executions, Workflow Test Case Executions, and Workflow Releases. Simply click on the "Graph View" icon tab located in the top right corner of the page to switch to the visual representation of the workflow.
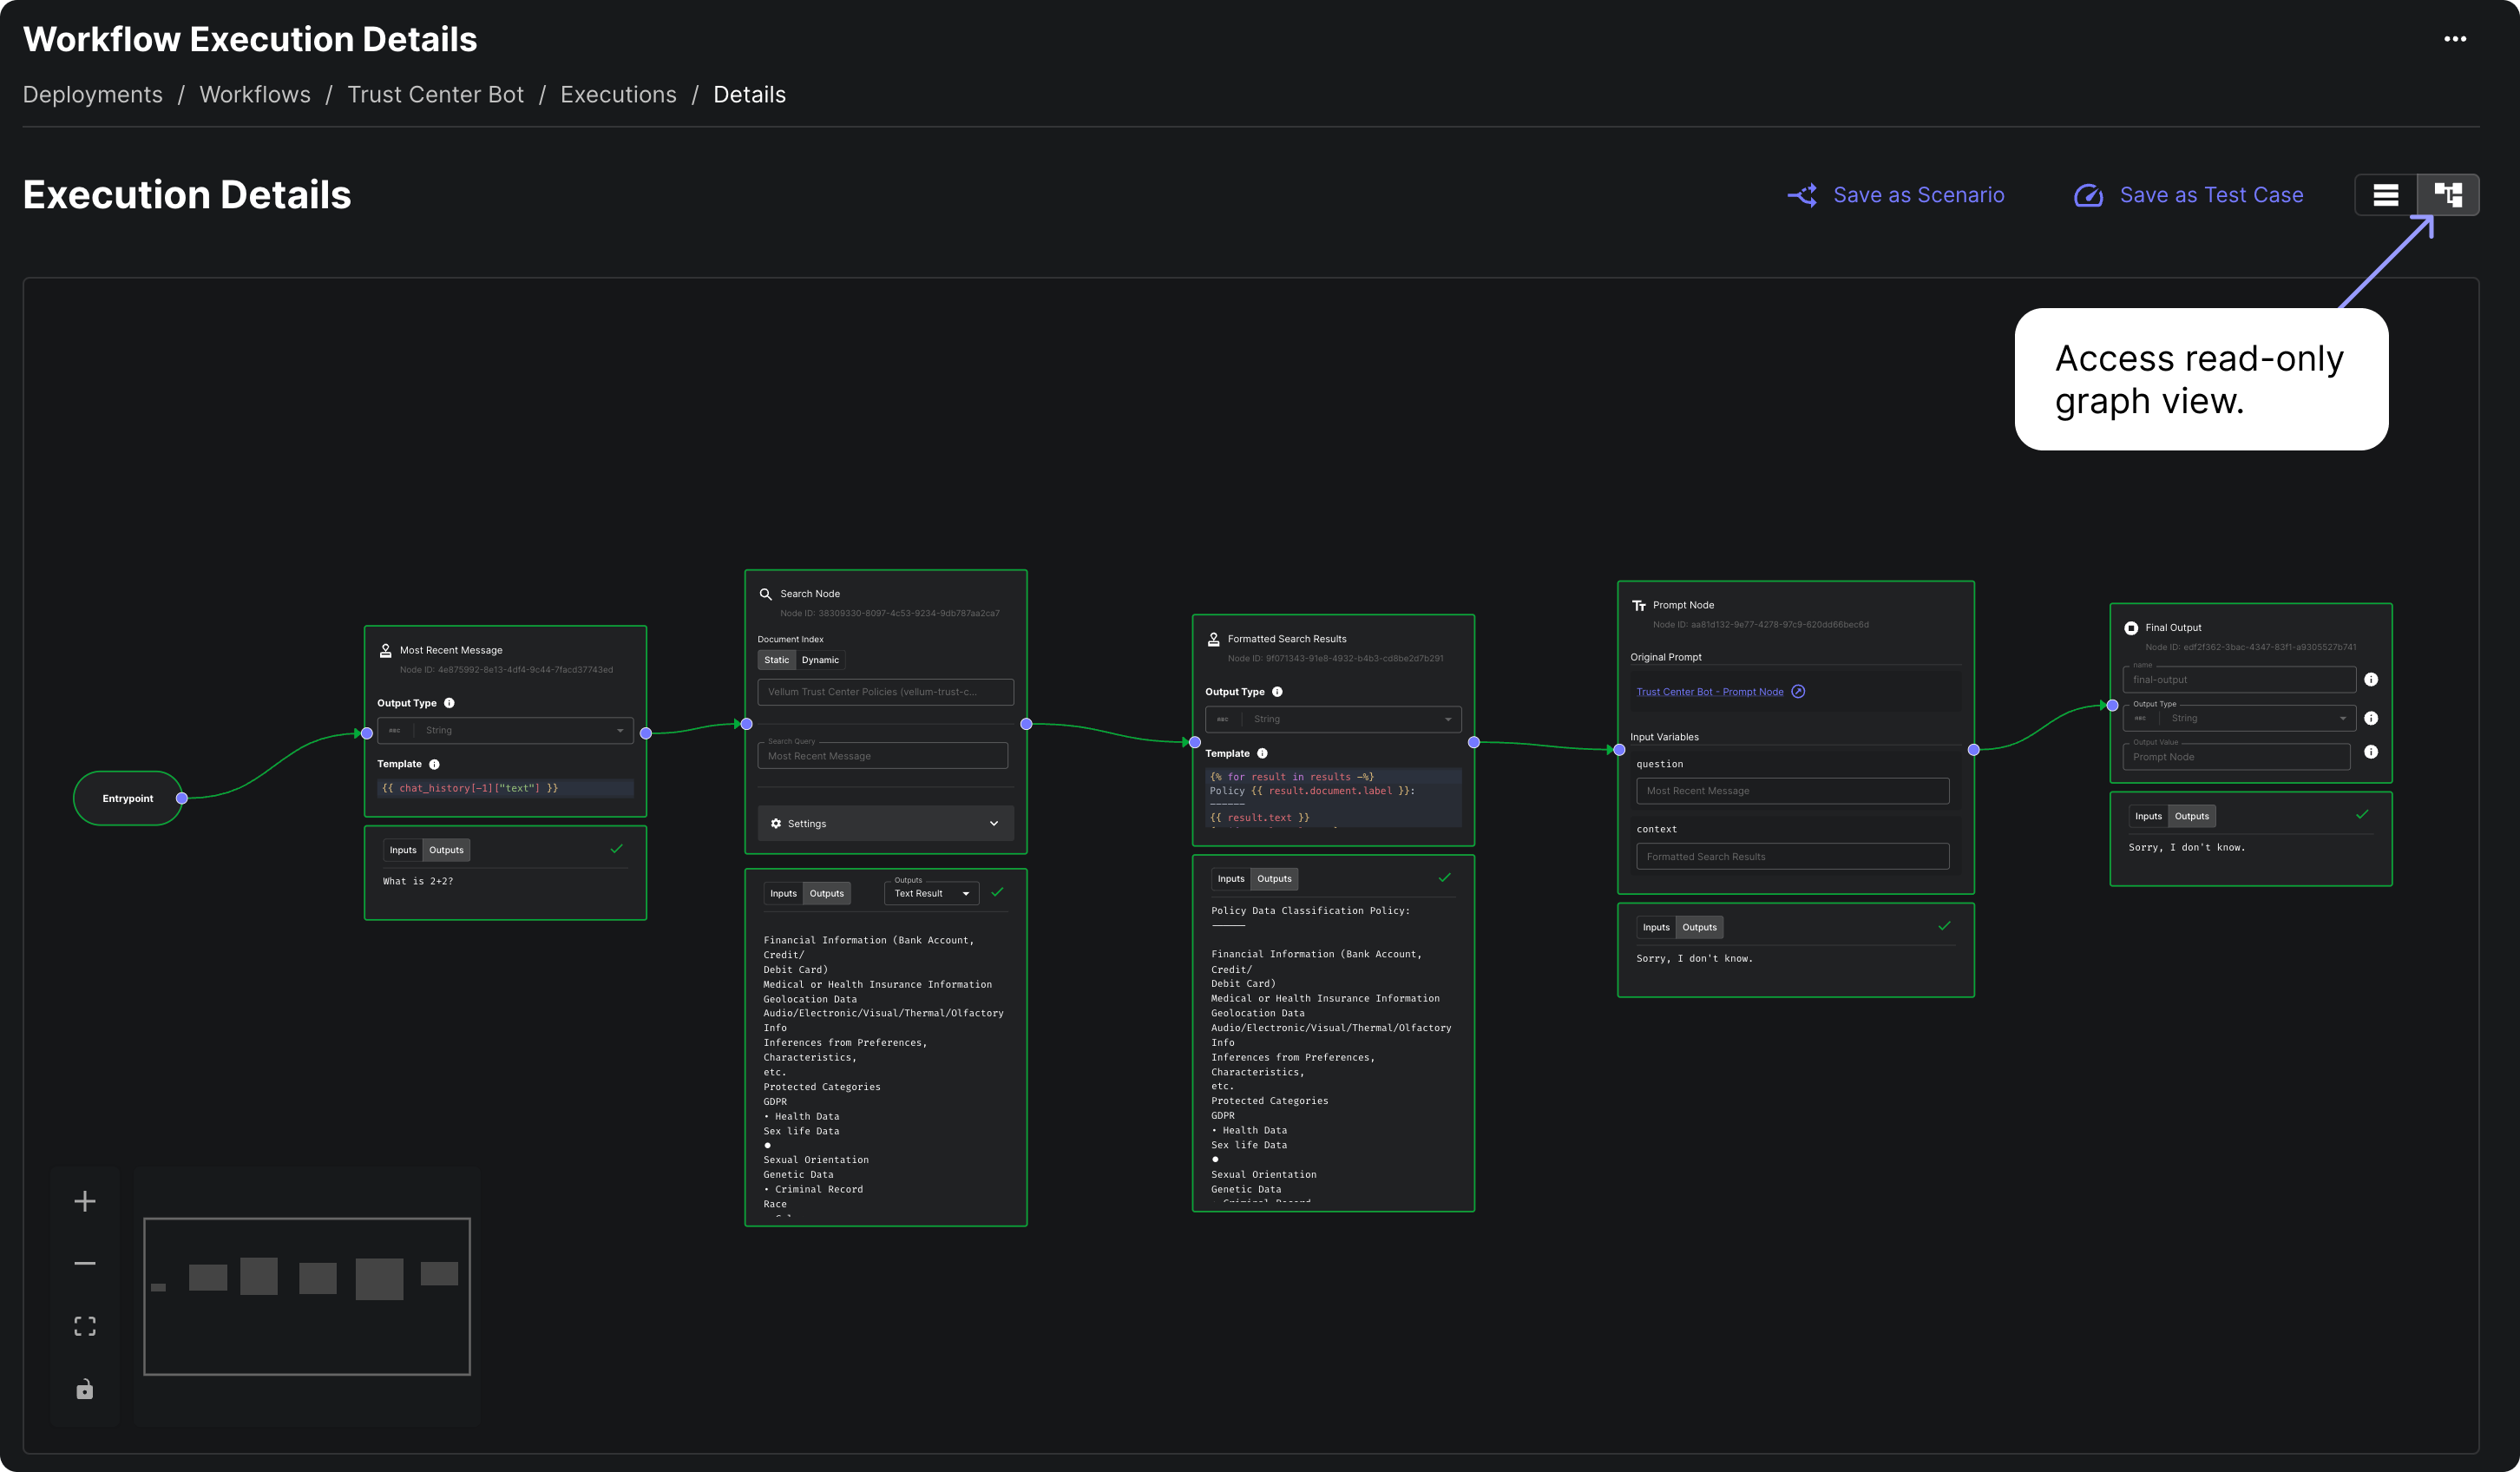
Now, it’s easier to visually trace the path the execution followed, making it simpler to debug issues, understand decision points, and communicate the workflow to others.
Workflow Node Mocking
When developing Workflows, you had to re-run the entire Workflow from start to finish every time, even if you only wanted to test a specific part. This could be time-consuming and expensive in terms of token consumption and runtime.
You can now mock out the execution of specific nodes in your Workflow! By defining hard-coded outputs for a node, you can skip its execution during development and return the predefined outputs instead. This allows you to focus on testing the parts of the Workflow you're actively working on without having to re-run the entire Workflow each time.

💡 Check our docs for more info, or watch the demo here .
⚠️ Keep in mind that these mocks are only available within Workflow Sandboxes and are defined per Scenario. They won't be deployed with your Workflow Deployments or affect the behavior when invoking Workflow Deployment APIs. During a run, mocked nodes will be outlined in yellow to different.
Easier Node Debugging
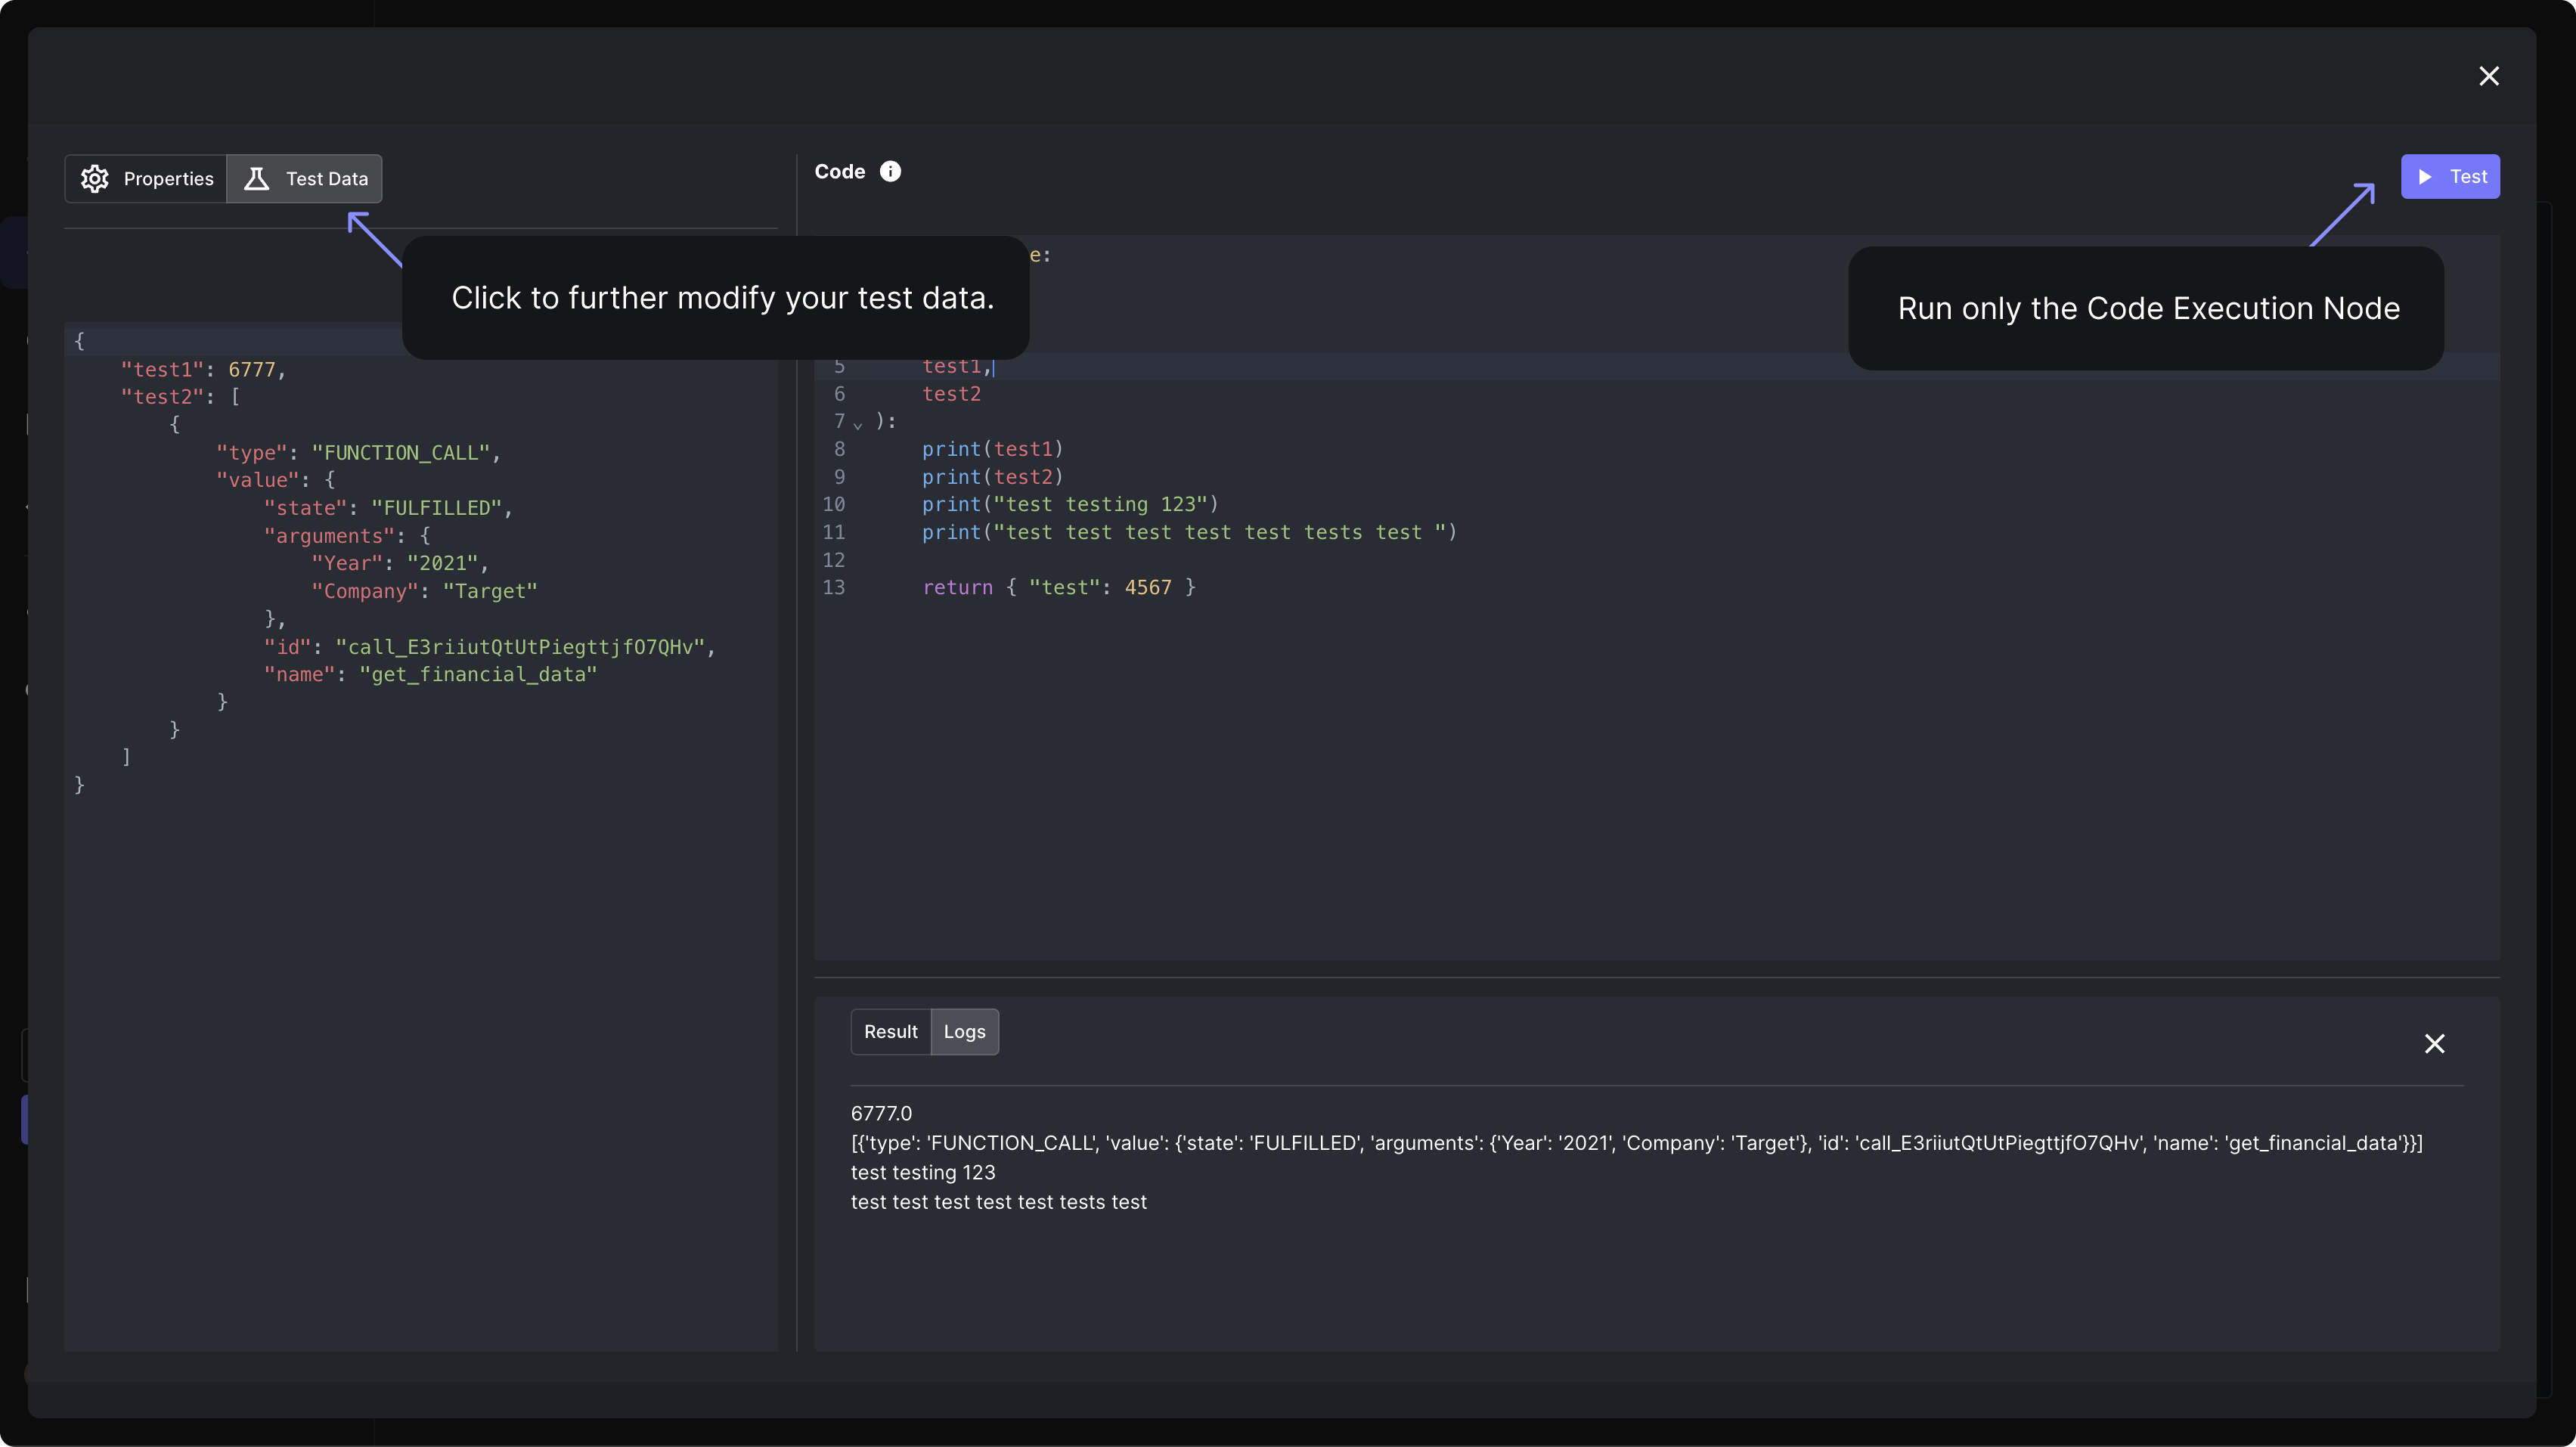
New debugging features are now available for Workflow Template Nodes , Code Execution Eval Metric , and Workflow Code Execution Nodes . For all of these, you can use the "Test" button in the full-screen editor to test elements individually without running the entire workflow or test suite. You can refine your testing by adjusting the test data in the "Test Data" tab.
Configurable Chunk Settings for Document Indexes
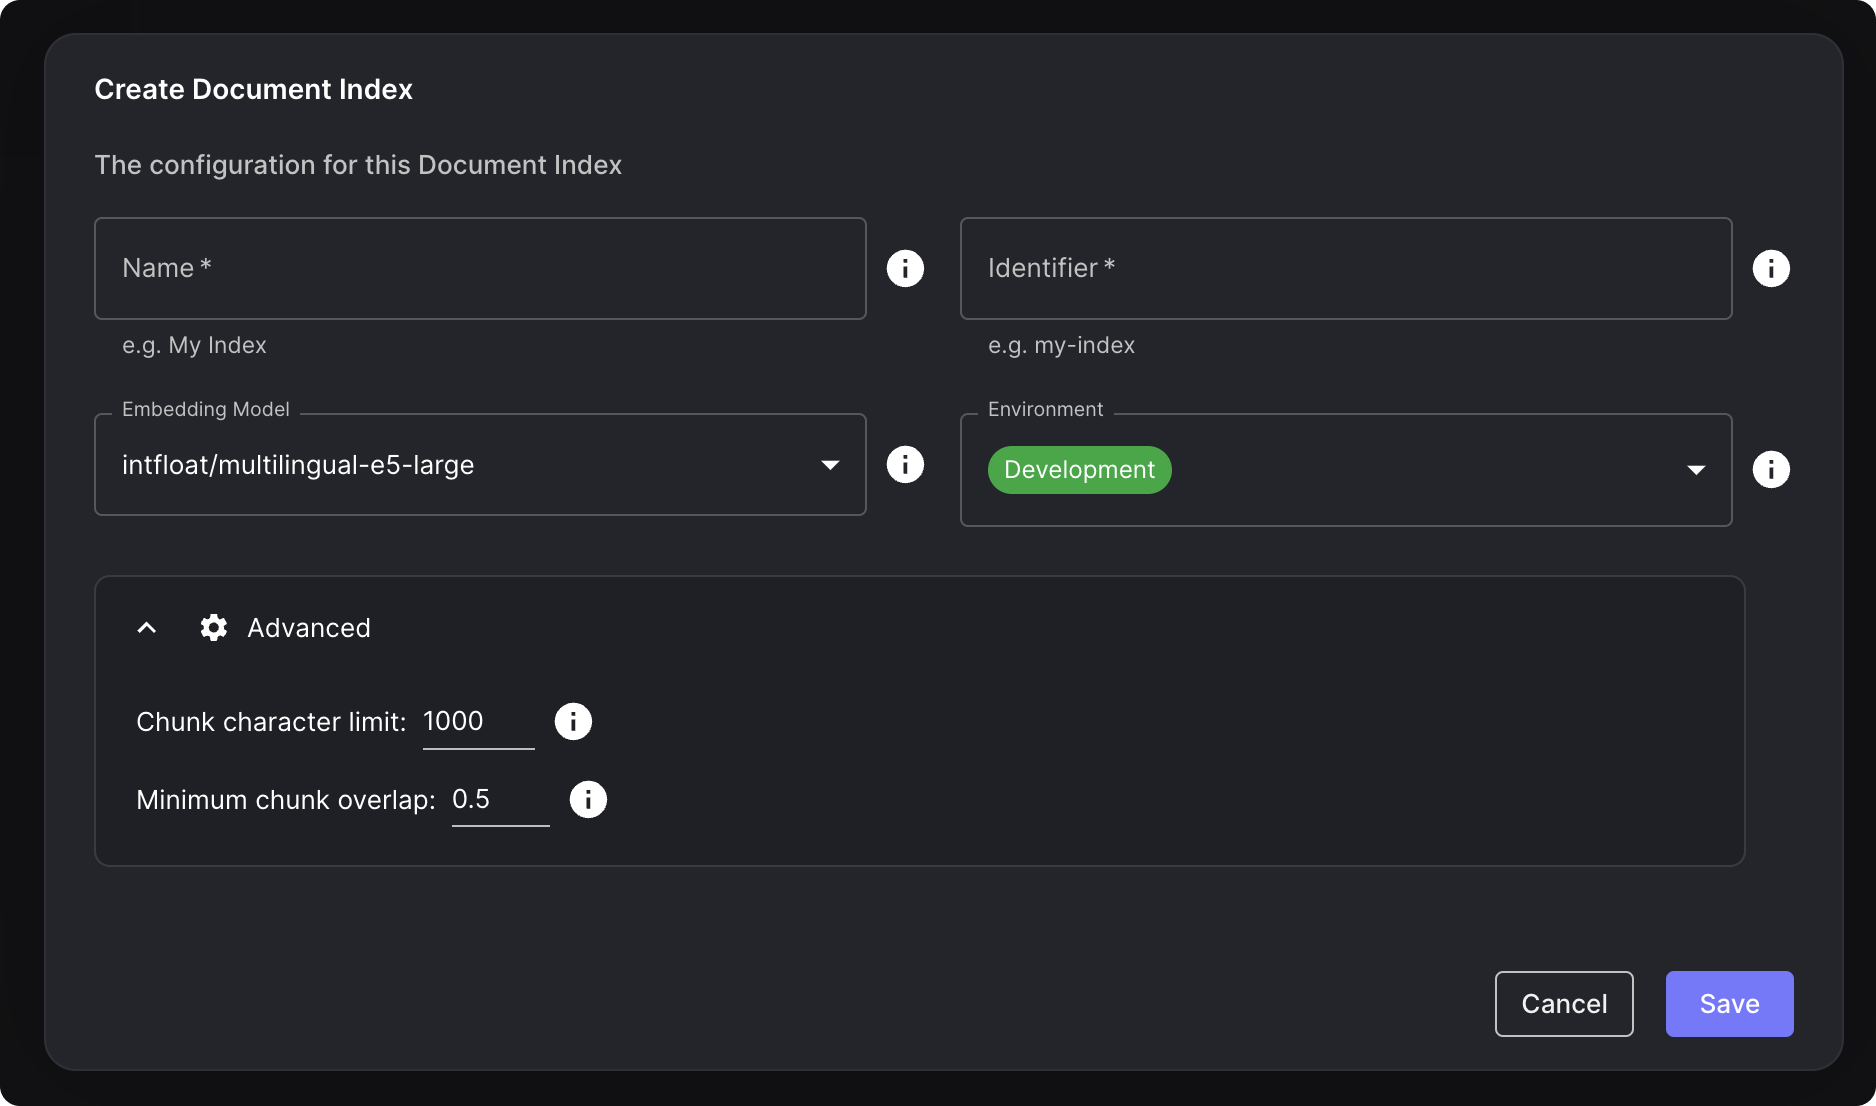
We've added the ability to configure the chunk size and the overlap between consecutive chunks for Document Indexes. You can find it under the "Advanced" section when creating or cloning a Document Index.
You can experiment with different chunk sizes and overlap amounts to optimize your Document Index for your specific use case and content, leading to more precise and relevant search results for your end users. This seemingly small change can have a big impact on improving the question-answering capabilities of your system.
Inline Editing for Evaluations
Previously, editing test cases in the "Evaluations" tab of Workflows and Prompts could be cumbersome, especially for test cases with long variable values or complex data structures like JSON. You had to edit the raw values directly in the table cells.
You can now edit test cases with a new, more user-friendly interface right from the "Evaluations" tab. This new editing flow provides several benefits:
Easier editing of test cases with long variable values; Ability to edit Chat History values using the familiar drag-and-drop editor used elsewhere in the app; Formatted editing support for JSON data.
🎥 Check the demo here .
We're continuing to add support for more variable types and will soon be applying this new edit flow to other tables throughout the app.
Code Execution Improvements
Code Execution Logs
You can now use print or console.log statements in Code Execution Workflow Nodes and Code Execution Eval Metrics and view the logs by looking at a node’s result and clicking the Logs tab.

Code Execution Node Improvements
We've made significant enhancements to Code Execution Nodes!
You can now include custom packages for Code Execution Workflow Nodes and Code Execution Eval Metrics , giving you greater flexibility and control over your code's dependencies. Additionally, we've expanded language support to include TypeScript, allowing you to select your preferred programming language from the new "Runtime" dropdown.
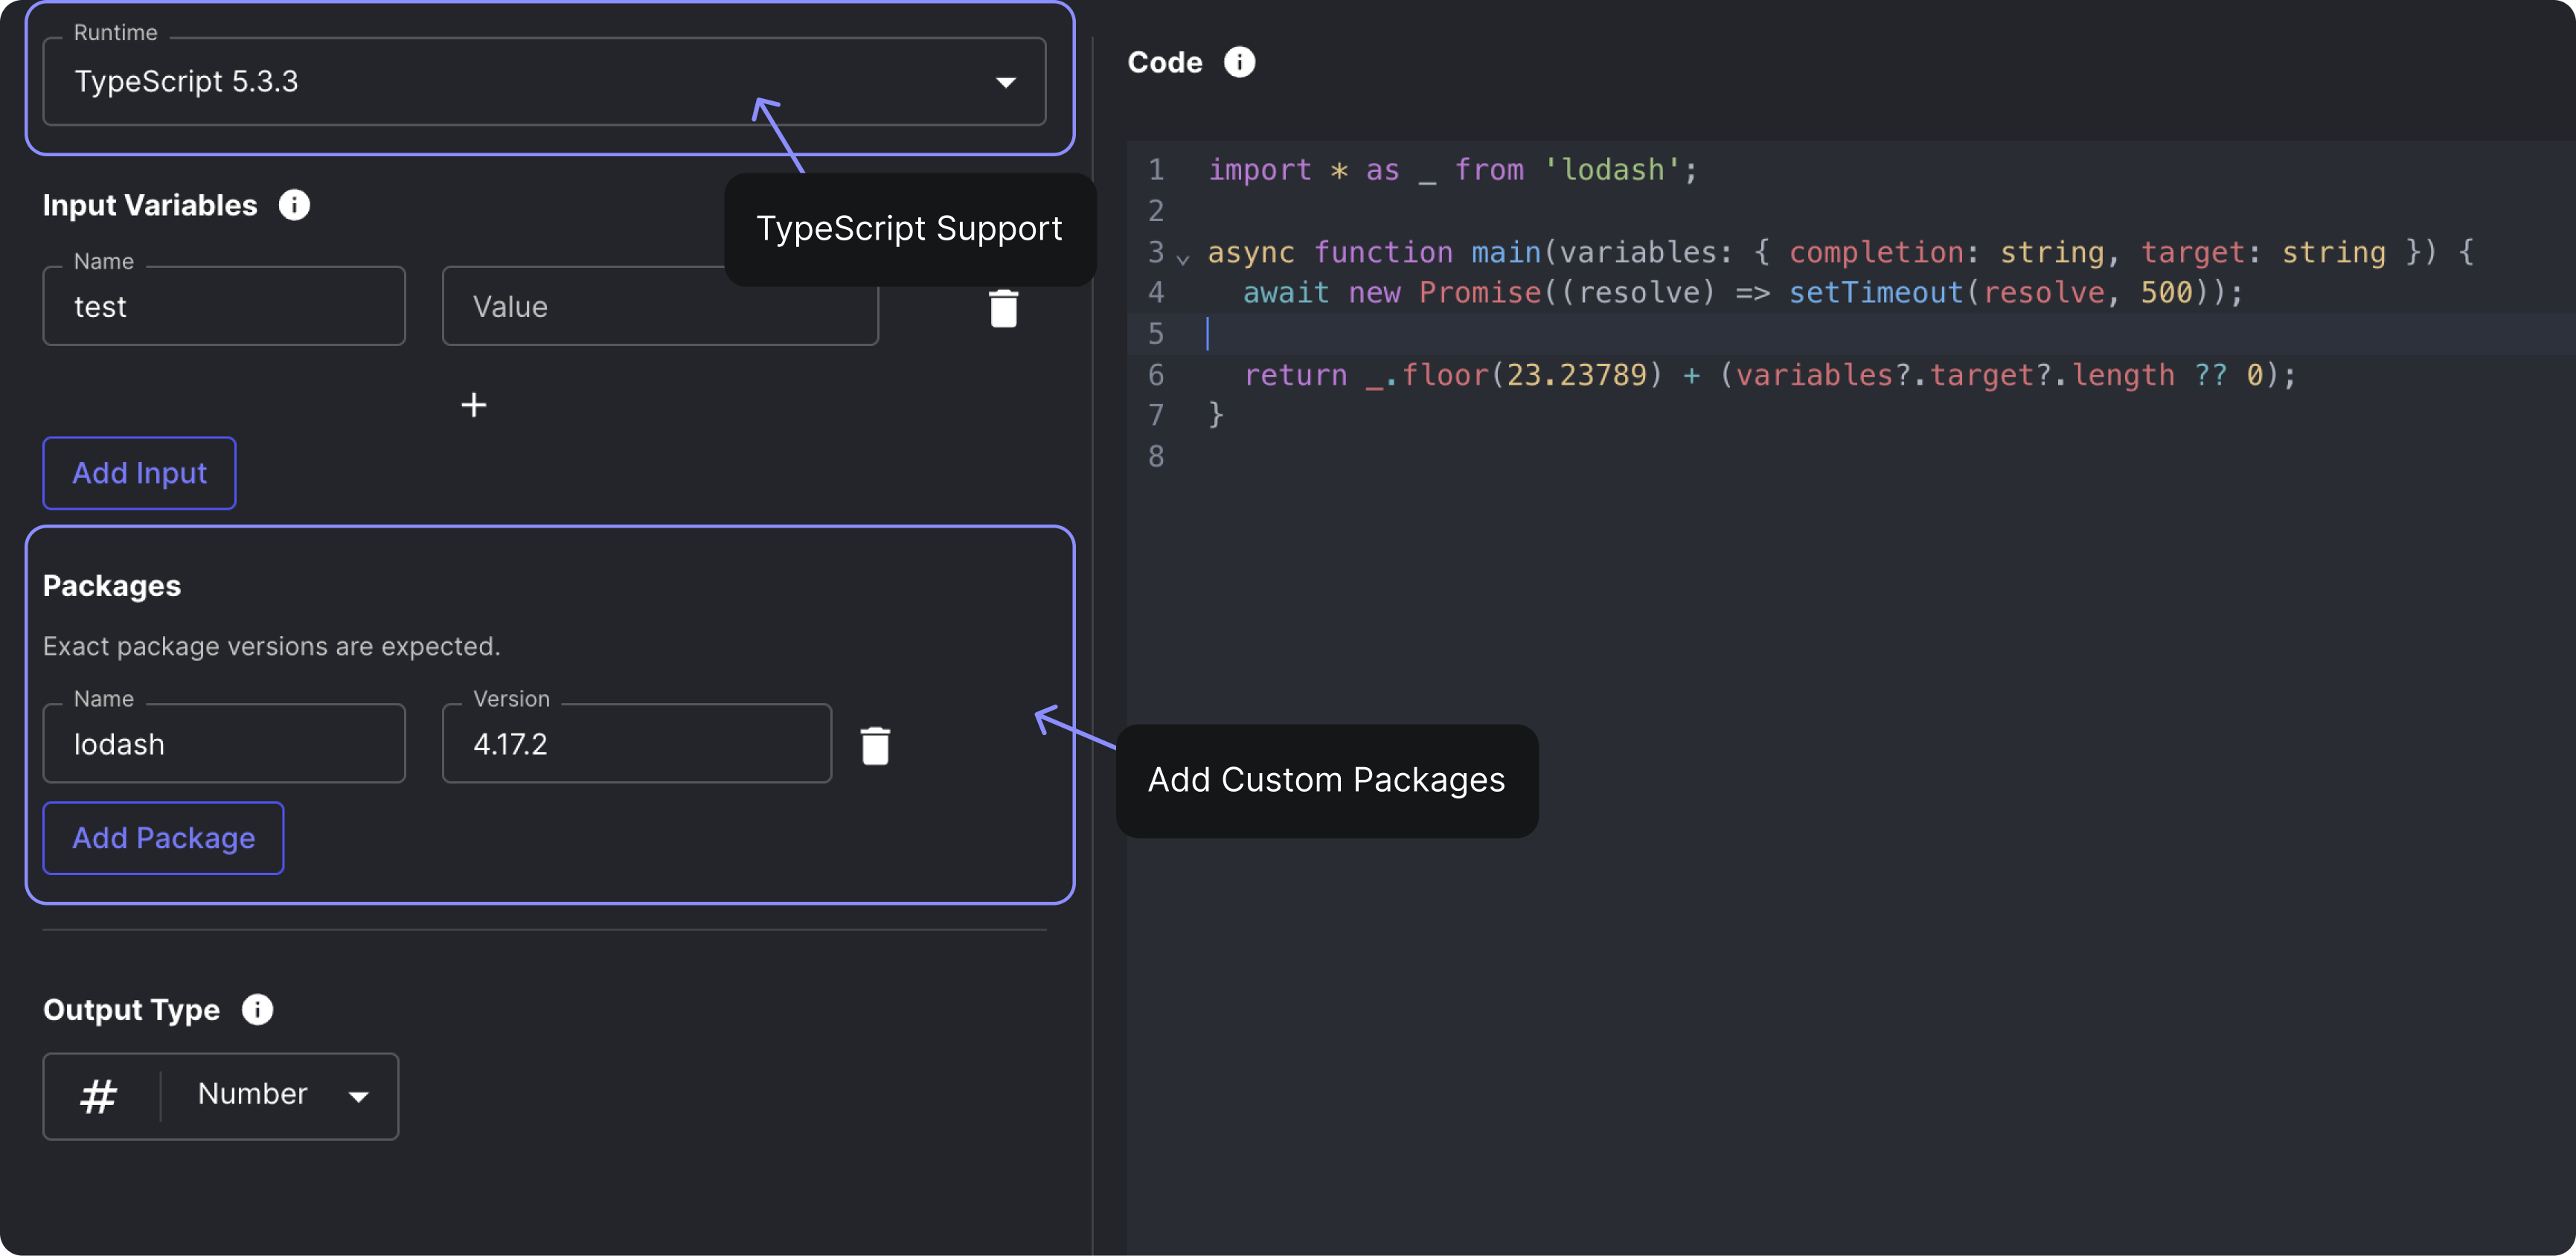
We've made some additional smaller improvements:
The code input size limit is raised to 10MB from the initial 128K characters Workflow code execution node editor layout updated with new side-by-side format All Vellum input types now supported for code execution node inputs Line numbers in the code editor will no longer be squished together
Other Workflow Improvements
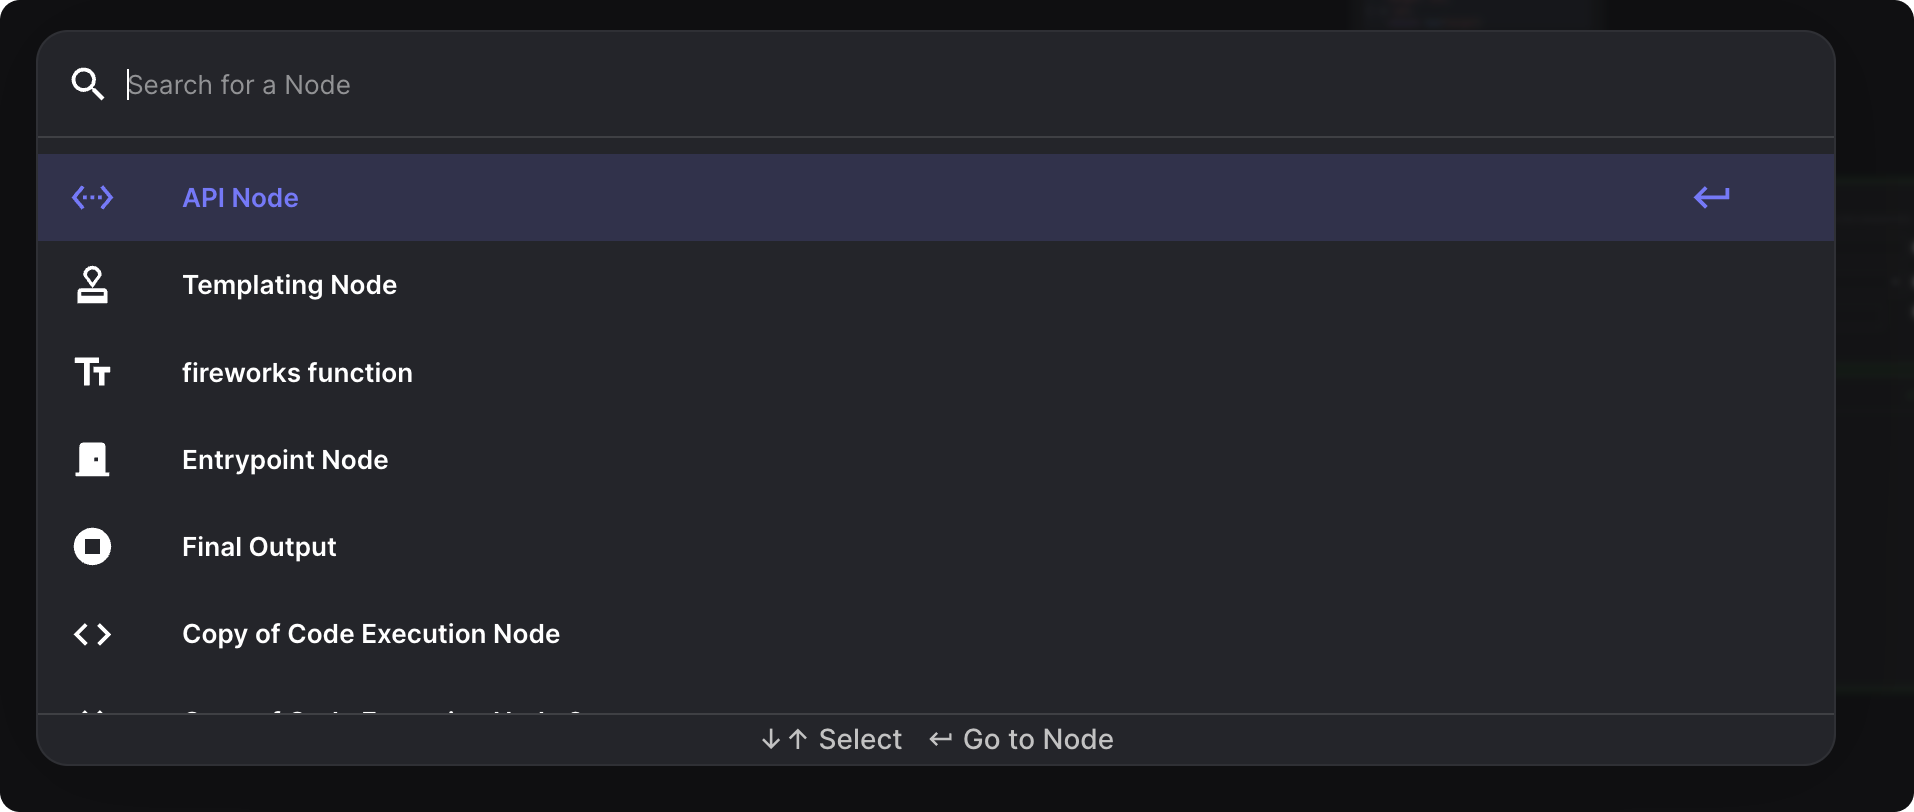
Workflow Node Search
We’ve added a new Workflow node search feature to help you find your way in large and complex Workflows. Click the new search icon in the top right to quickly find the node you are looking for, or use the ⌘ + shift + F shortcut ( ctrl + shift + F on Windows).
Workflow Node “Reject on Error” Toggle
Previously, when a Node in a Workflow encountered an error, the Workflow would continue executing until a downstream Node attempted to use the output of the Node that errored. Only at that point would the Workflow terminate. This behavior made Workflows difficult to debug and required you to implement your own error handling.
Now, by default, Workflows will immediately terminate if any Node encounters an error. This new behavior is controlled by the "Reject on Error" toggle, which is enabled by default for new Nodes.

However, there may still be cases where you want the Workflow to continue despite a Node error, such as when implementing your own error handling or retry logic. In these situations, you can disable the "Reject on Error" toggle on the relevant Nodes.
⚠️ Existing Workflow Nodes will have the "Reject on Error" toggle disabled to maintain their current behavior and prevent any unexpected changes.
Workflow Node Input Value Display
Now, you can directly view a Node's input values from the Workflow Editor! This simplifies the process of understanding the data being passed into a Node and debug any issues.

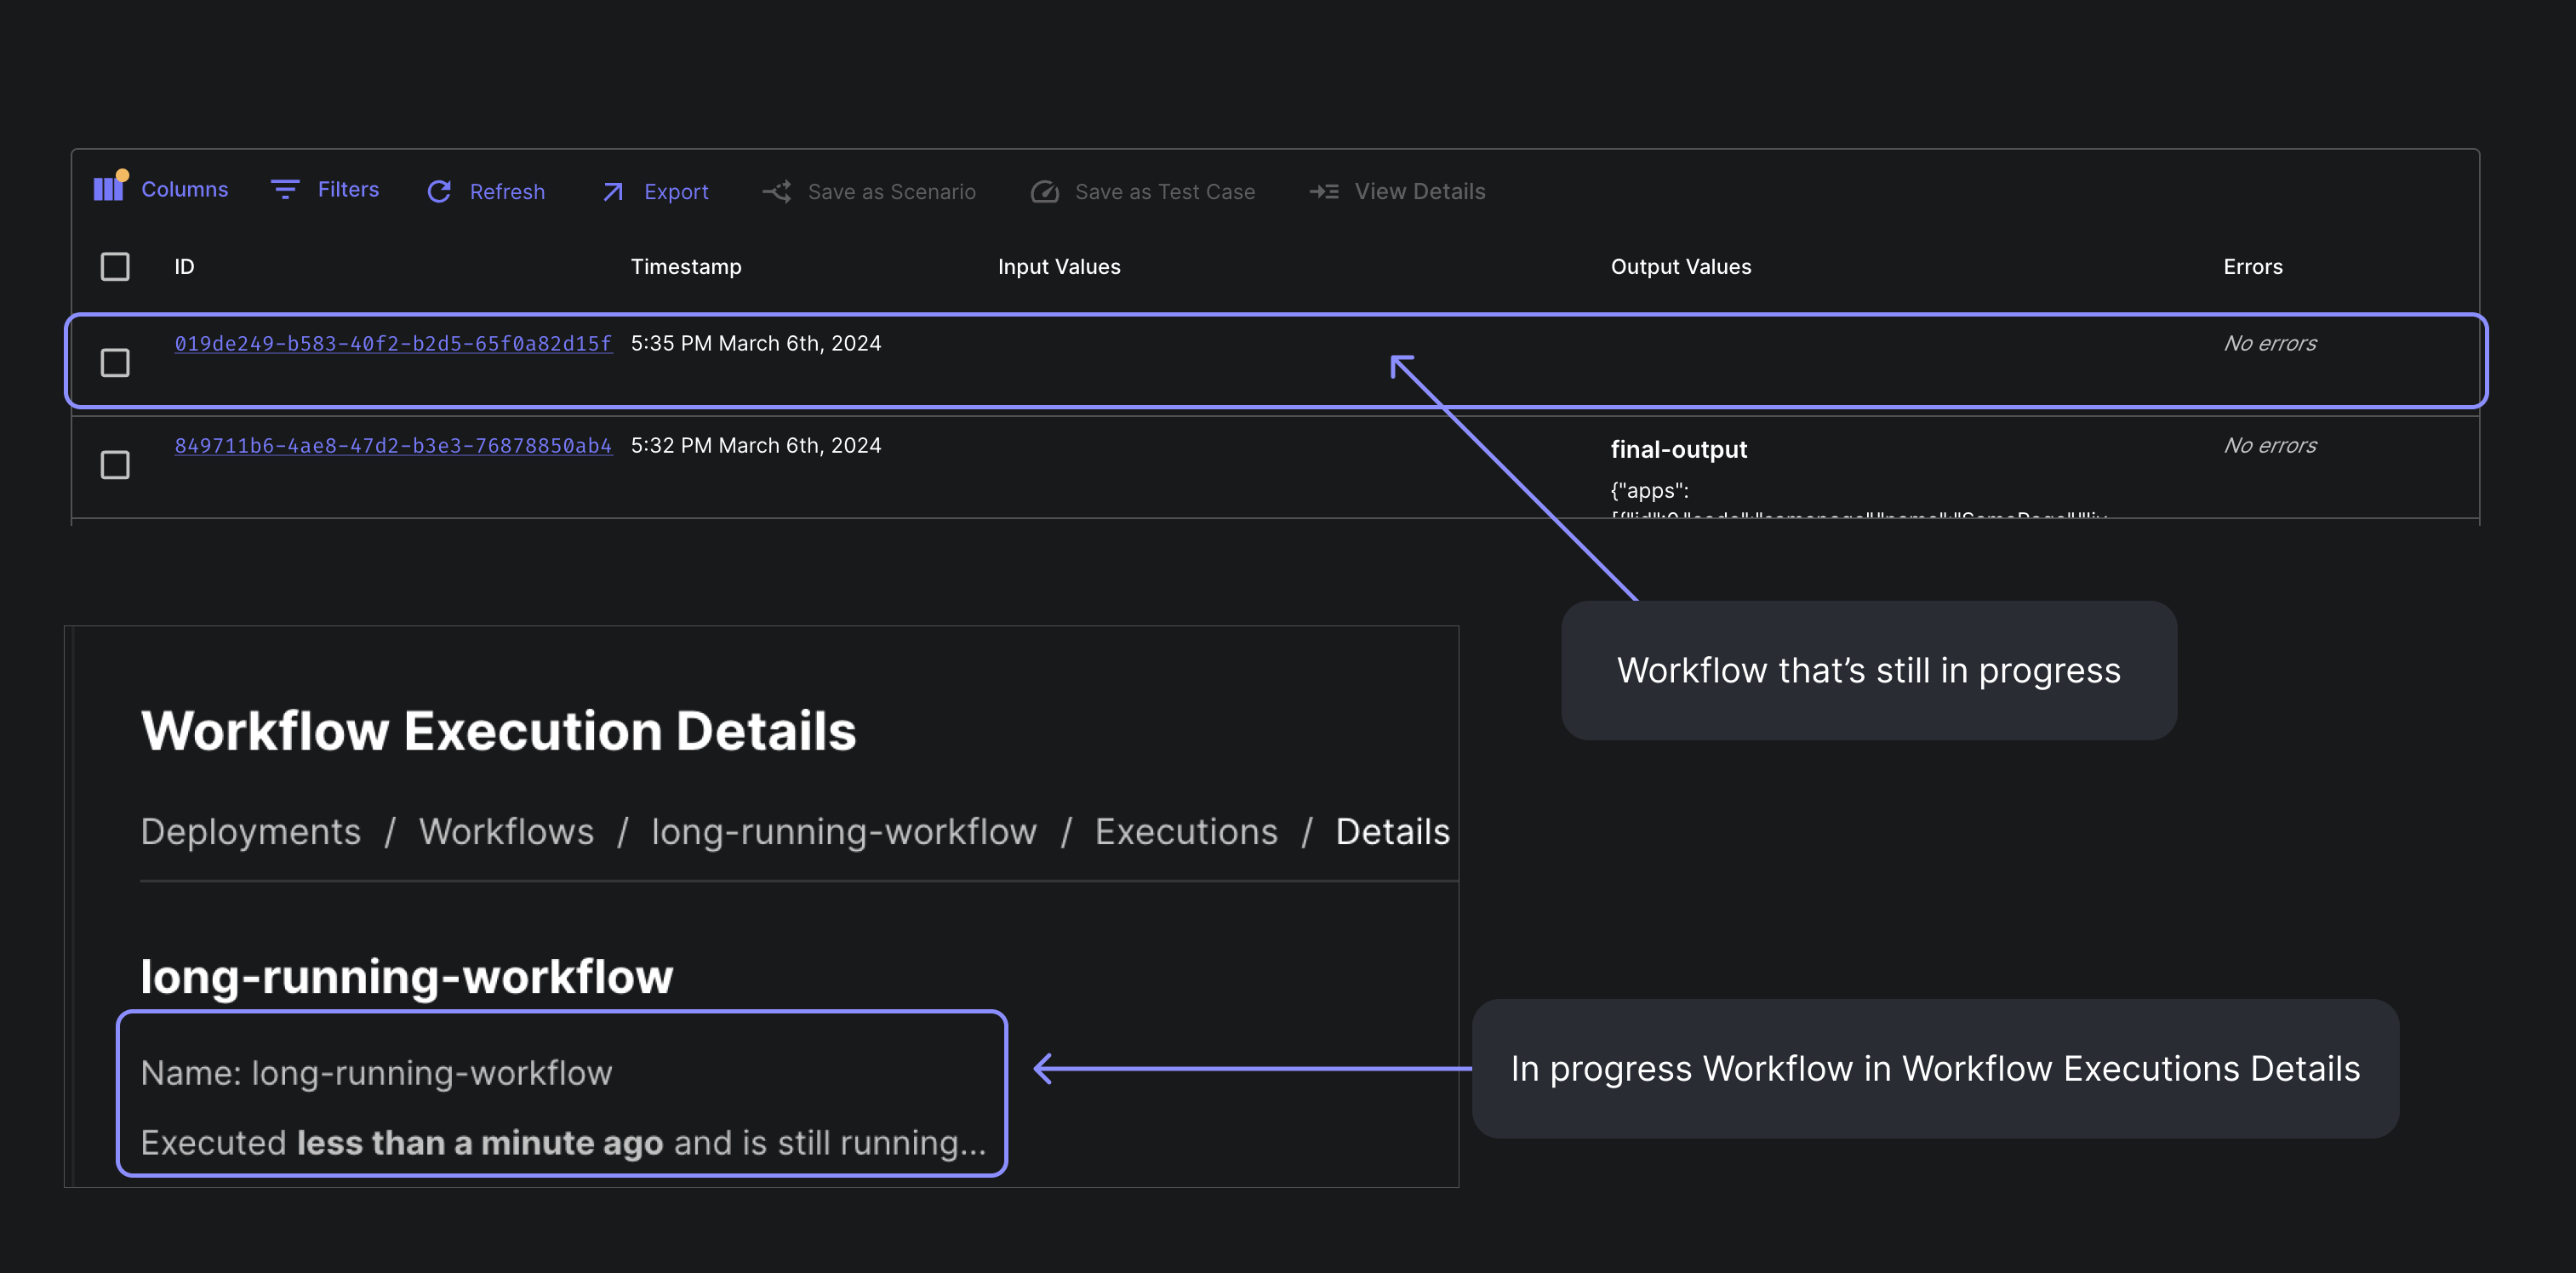
Monitor In-Progress Workflows Executions
Previously, you had to wait until a workflow fully resolved to view it in the Workflow Executions table. Now, we begin publishing executions as soon as workflows are initiated.
This enables you to monitor those executions still in progress on the “Executions” table even for more complex, long-running workflows.
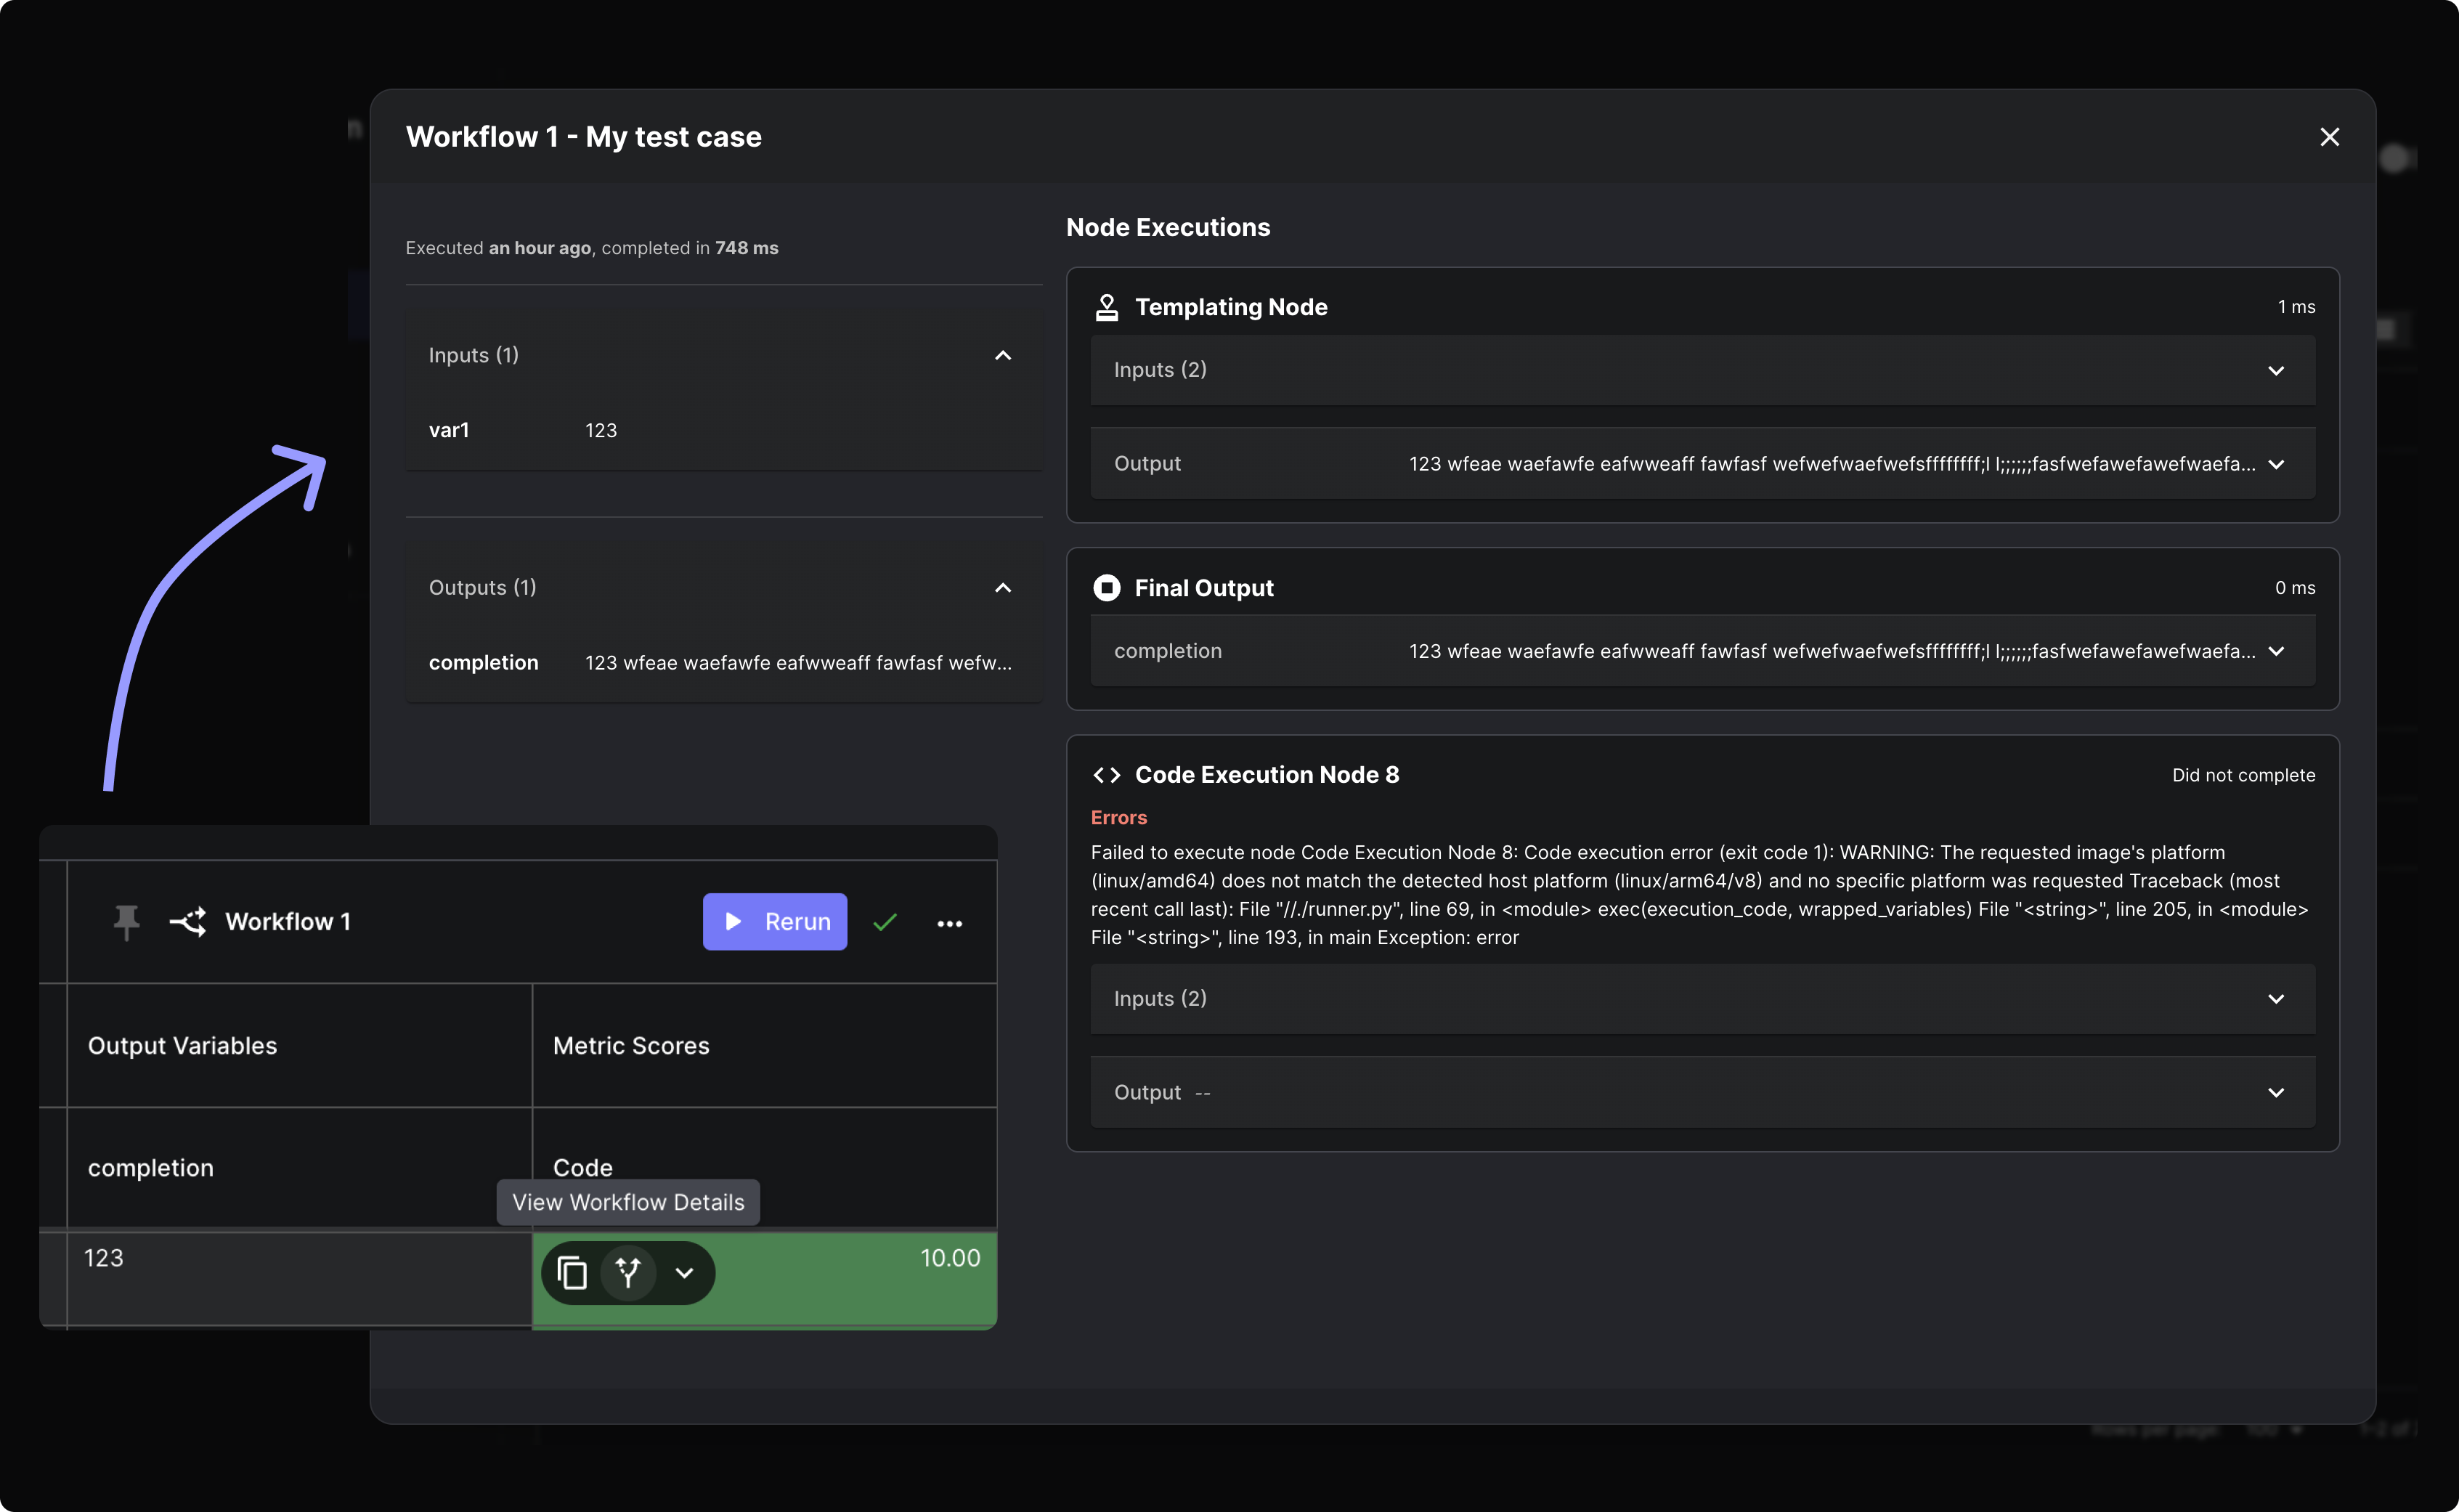
Workflow Details for Workflow Evaluations
You can now view Workflow Execution details from the Workflow Evaluations table! To view the details, click on the new "View Workflow Details" button located within a test case's value cell.
Cancellable Workflow Deployment Executions
You can now cancel running Workflow Deployment Executions. Simply click the cancel button on the Workflow Execution details page.

New API endpoints
List Document Indexes API
We've exposed a new API endpoint to list all the Document Indexes in a Workspace. You can find the details of the API here .
Retrieve Workflow Deployment API
Now, you have the capability to fetch information regarding a Workflow Deployment. This functionality proves valuable for tasks such as programmatically identifying the existence of a Workflow Deployment with a specific name or verifying its expected inputs and outputs. You can find the details of the API here .
Quality of Life Improvements
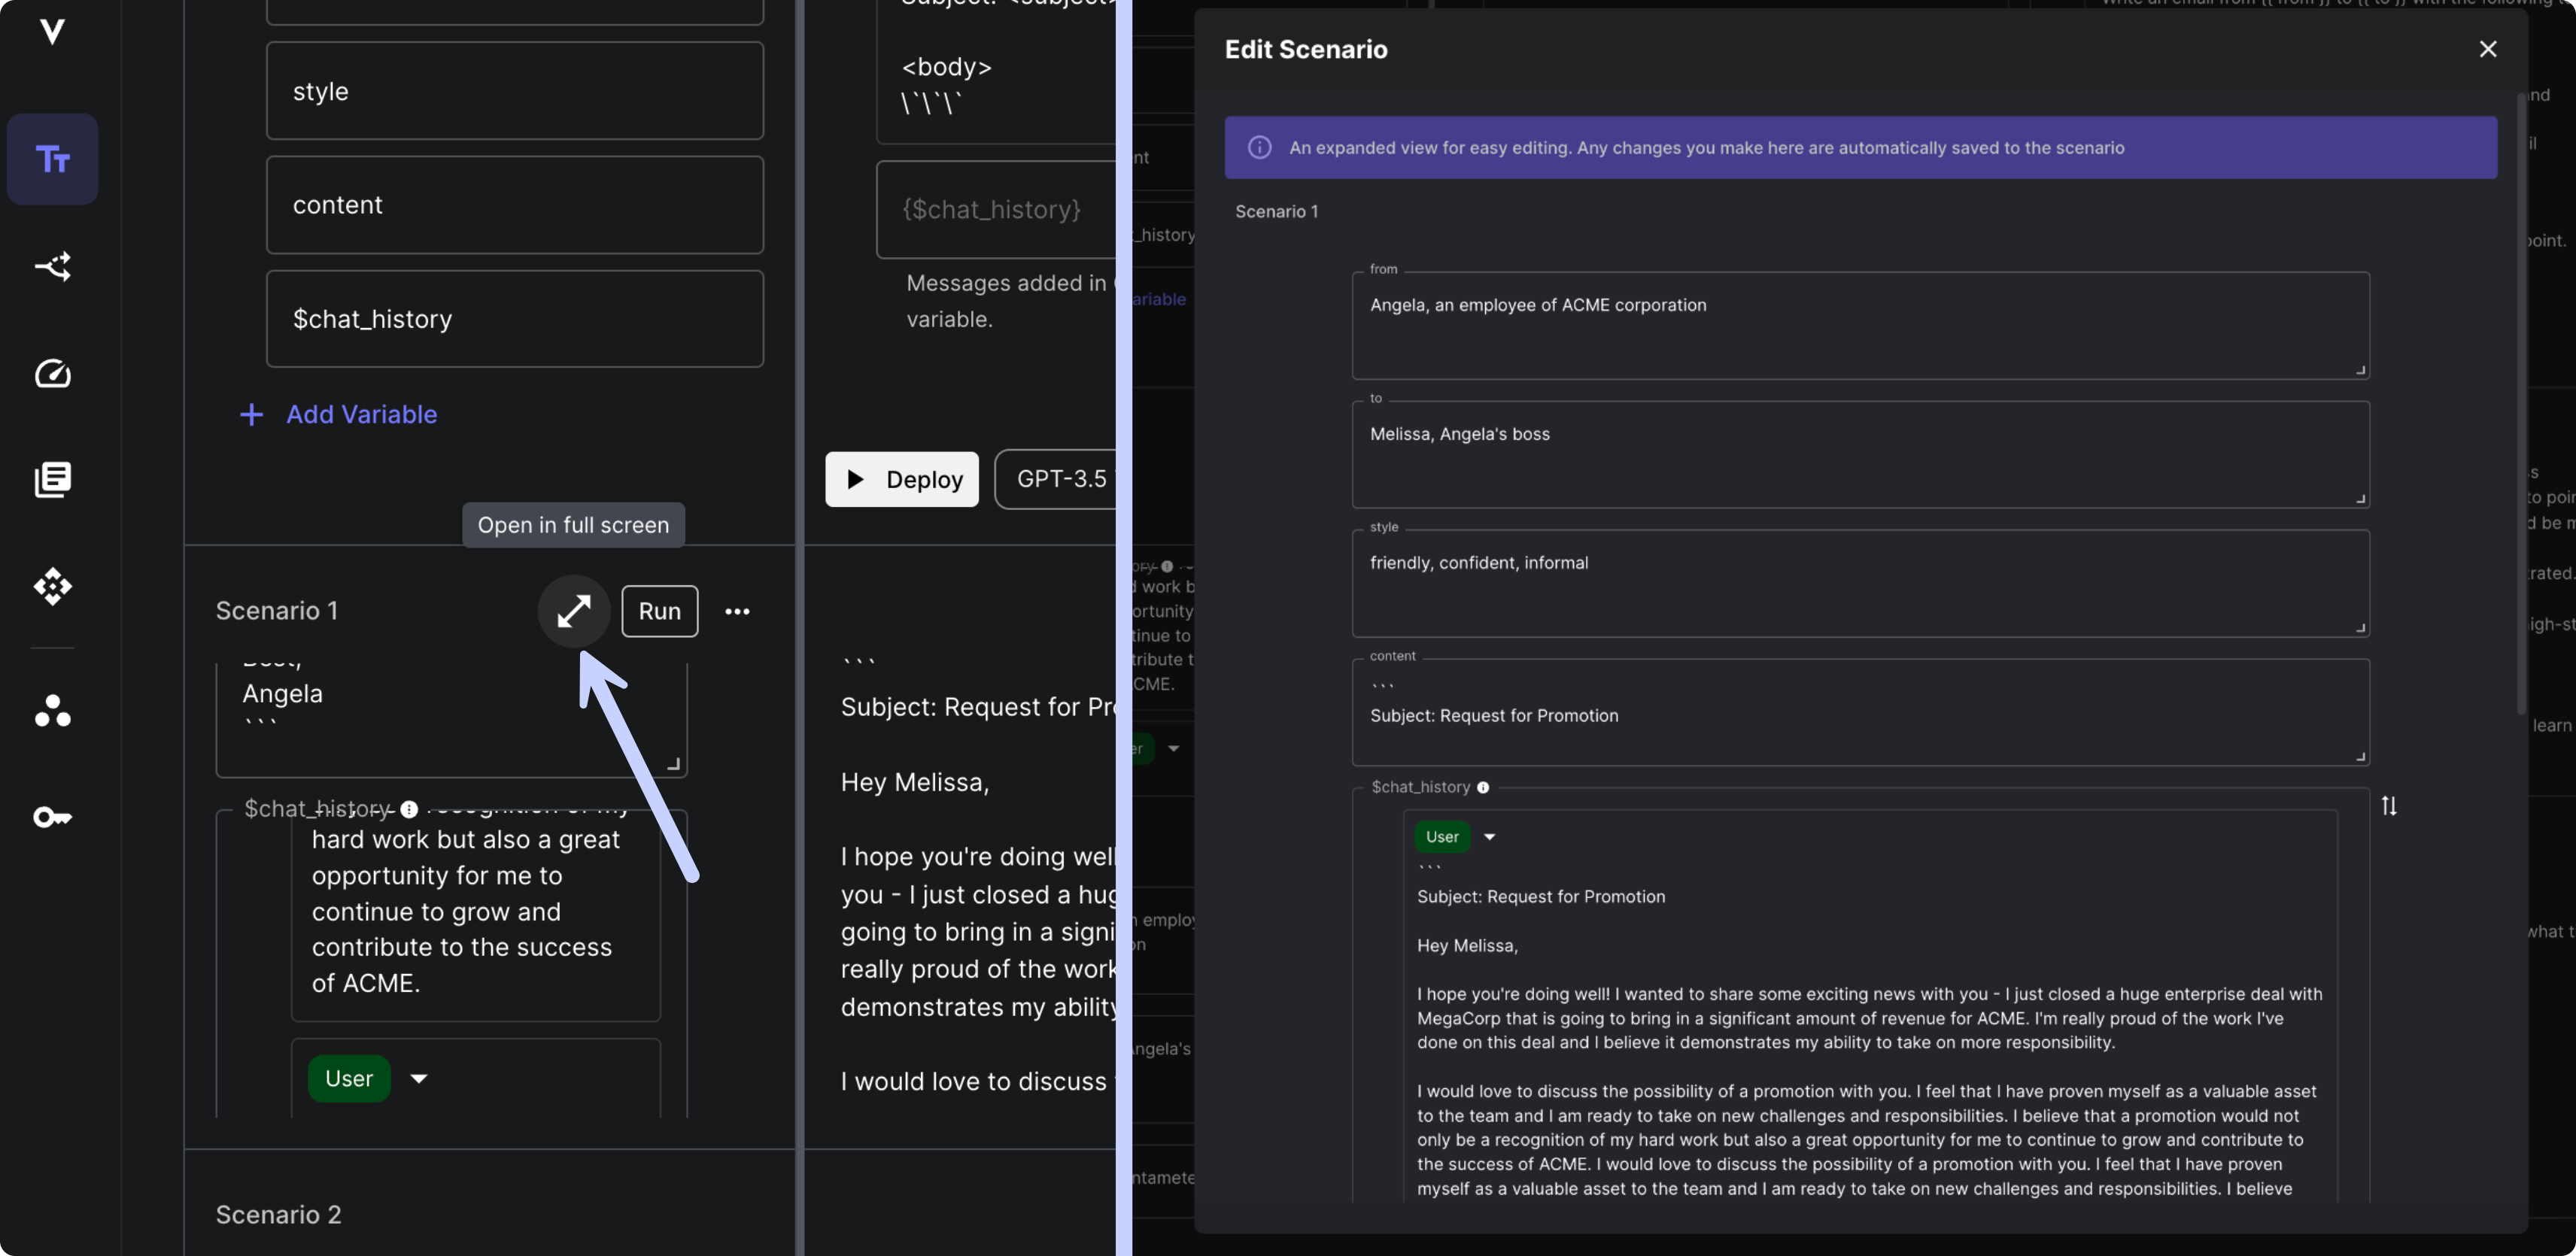
Expand Scenario in Prompt Sandbox
Need more space to edit your scenarios in the prompt sandbox? Introducing our new expand scenario modal! Easily modify scenarios with longer inputs now.
Claude 3 Opus & Sonnet
Anthropic's latest models, Claude 3 Opus and Claude 3 Sonnet, are now accessible in Vellum! These models have been integrated into all workspaces, making them selectable from prompt sandboxes after refreshing the page.
Claude 3 and Mistral on Bedrock
Additionally, we now support both of the Claude 3 and both of the Mistral models on AWS Bedrock.
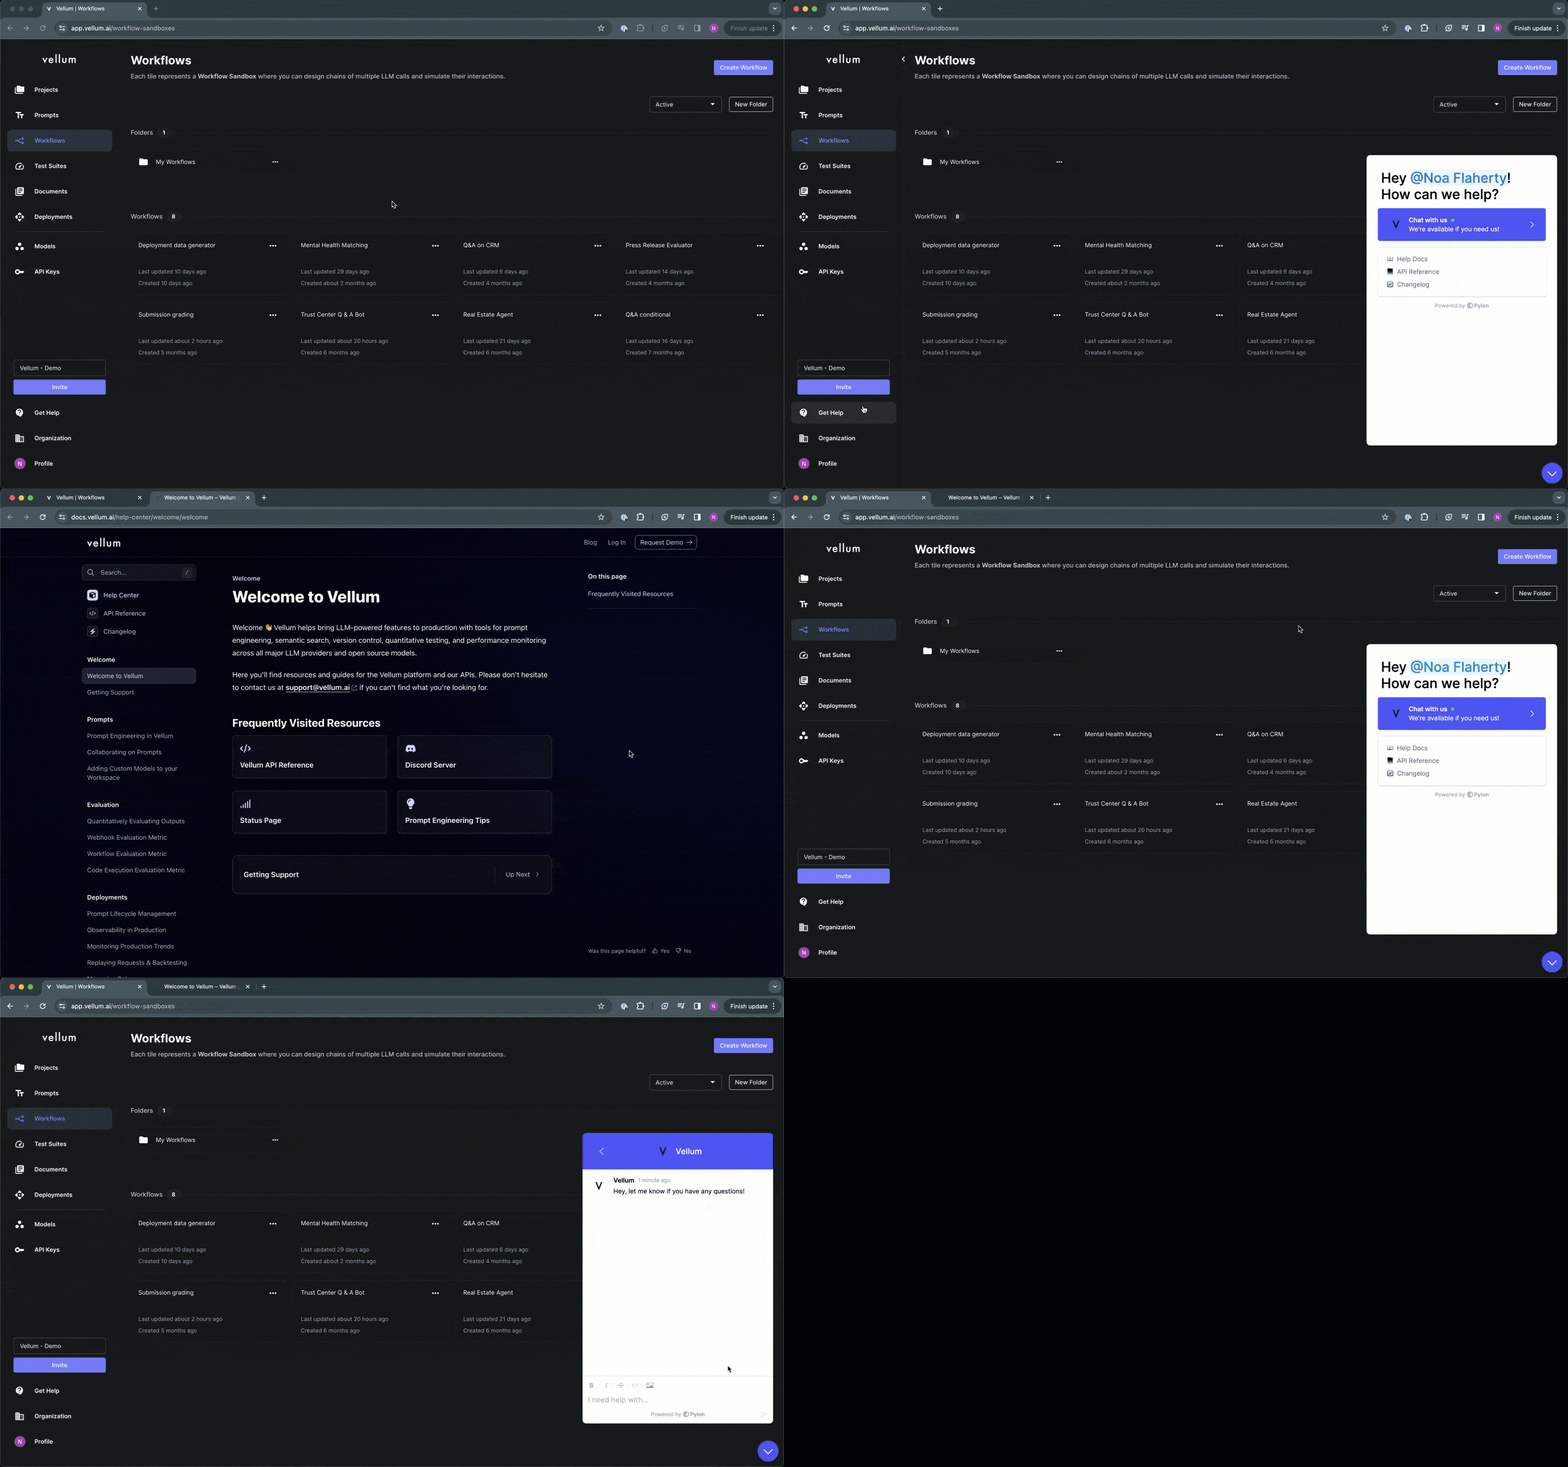
In-App Support Now Accessed via "Get Help" Button
Previously, the In-App Support Widget, located in the bottom right corner of the screen, often obstructed actions such as accessing Save buttons.
Now, the widget is hidden by default, and you can access it by clicking the "Get Help" button in the side navigation. Additionally, when opened, we provide bookmarked links to helpful resources, such as the Vellum Help Docs.
Indicators for Deployed Prompt/Workflow Sandboxes
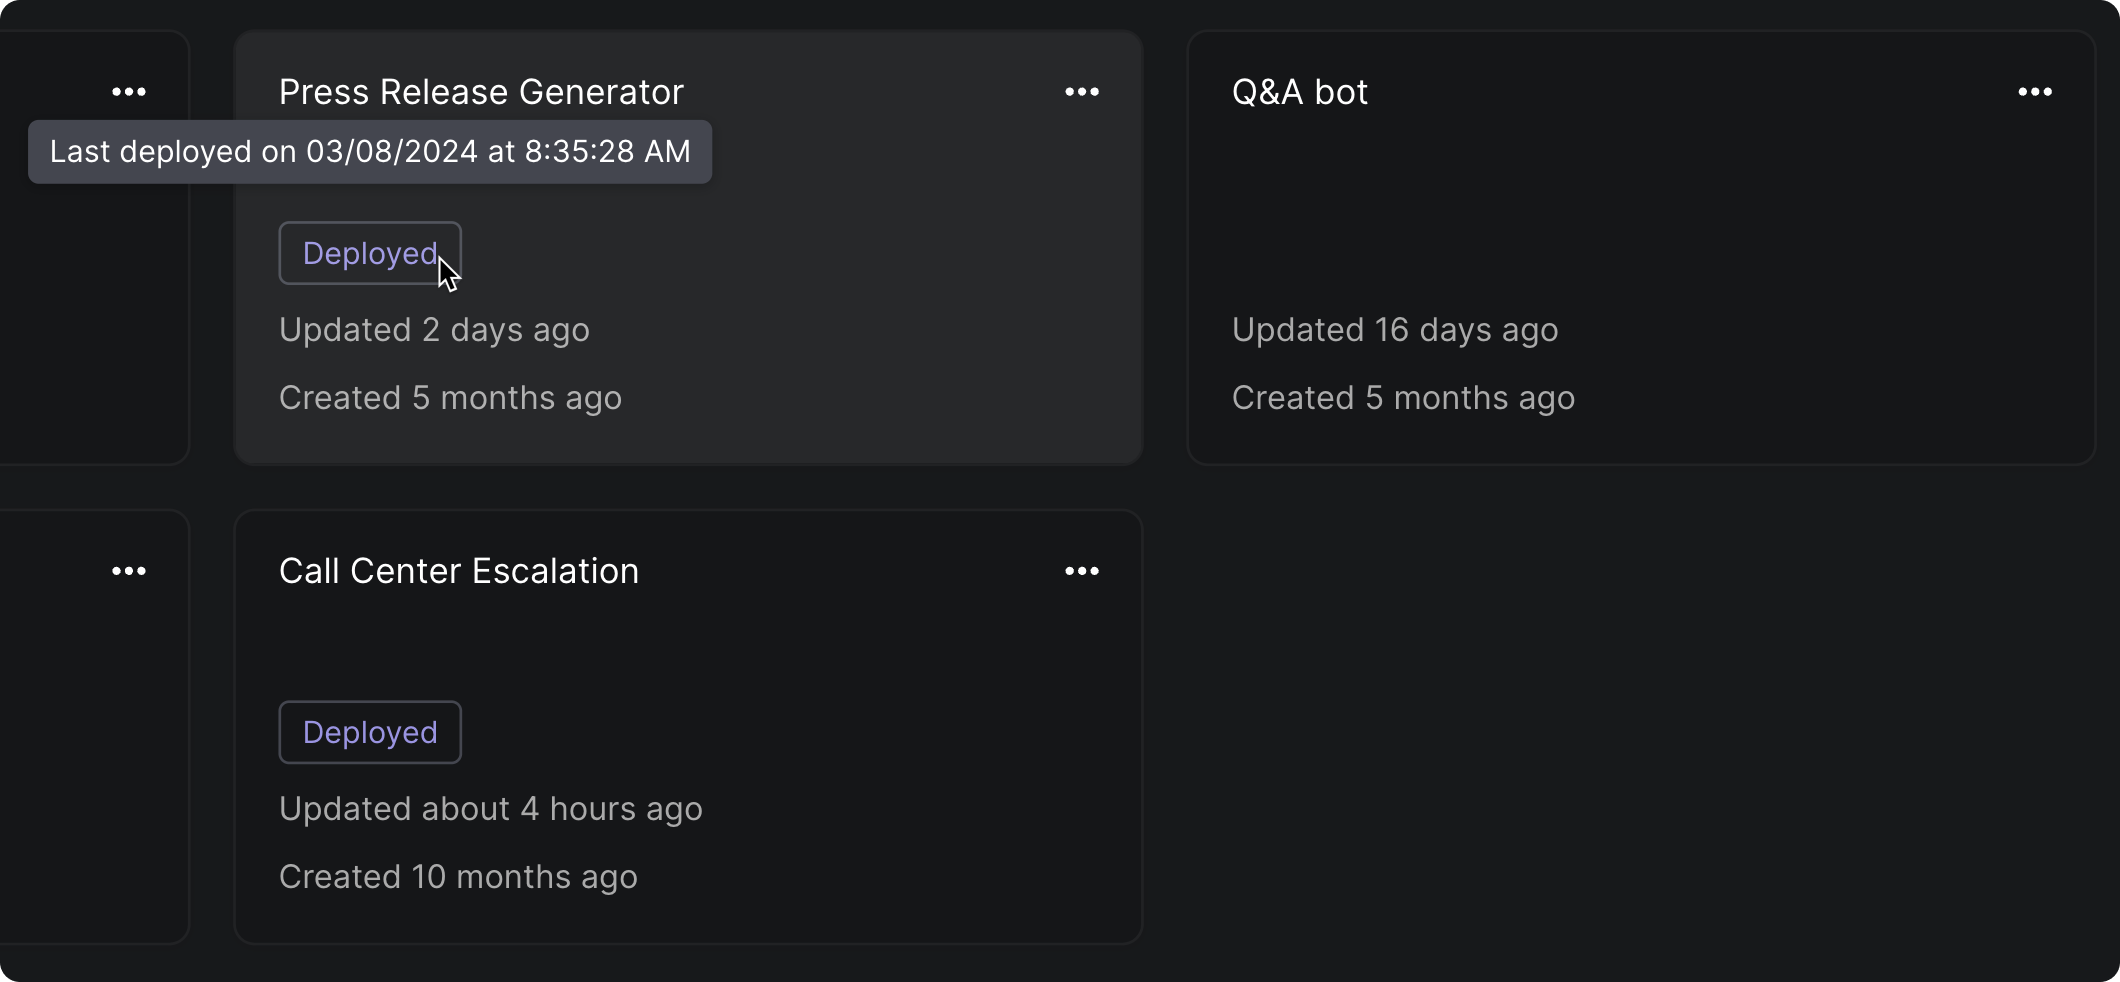
You can now tell at a glance whether a given Prompt/Workflow Sandbox has been deployed. You can also hover over the tag to see when it was last deployed.
Additional Headers on API Nodes
Previously, API Nodes only accepted one configurable header, defined on the Authorization section on the node. You can now configure additional headers in the new advanced Settings section. Header values could be regular STRING values or Secrets, and any headers defined here would override the Authorization header.
Navigation Updates
Vellum's navigation UI is updated for better flow. Sidebars now have submenus for easier access to Sandbox, Evaluations, and Deployments, with some items reorganized under "More" and "Settings."

Looking ahead
We've been busy developing exciting new features for April! You won't want to miss the product update next month ☁️☁️☁️
A huge thank you to our customers whose valuable input is shaping our product roadmap significantly!