It’s October and you know what that means! Pumpkin spice and Vellum product updates are in the air 🎃
This month, we shipped 18 changelog-worthy items to make development sweeter and spicier. From higher performance evals supporting 10,000+ row test suites, to improved Map Node debugging, new models, and a slew of new ways to monitor production deployments— there’s a little something for everybody this month!
Let’s dive in.
Workflow Execution Timeline View Revamp
We gave the Workflow Execution Timeline View a major facelift. This view is useful for debugging complex agentic workflows, where you need to understand precisely how agents are interacting with one another and making decisions. It’s also useful for optimizing latency and cost in individual steps.
Along with a more modern look, we added some quality of life improvements:
Subworkflows : Instead of needing to navigate to a separate page, you can now expand Subworkflows to view their executions details within the same page. This gives you a full trace view of graphs composed of sub-graphs.
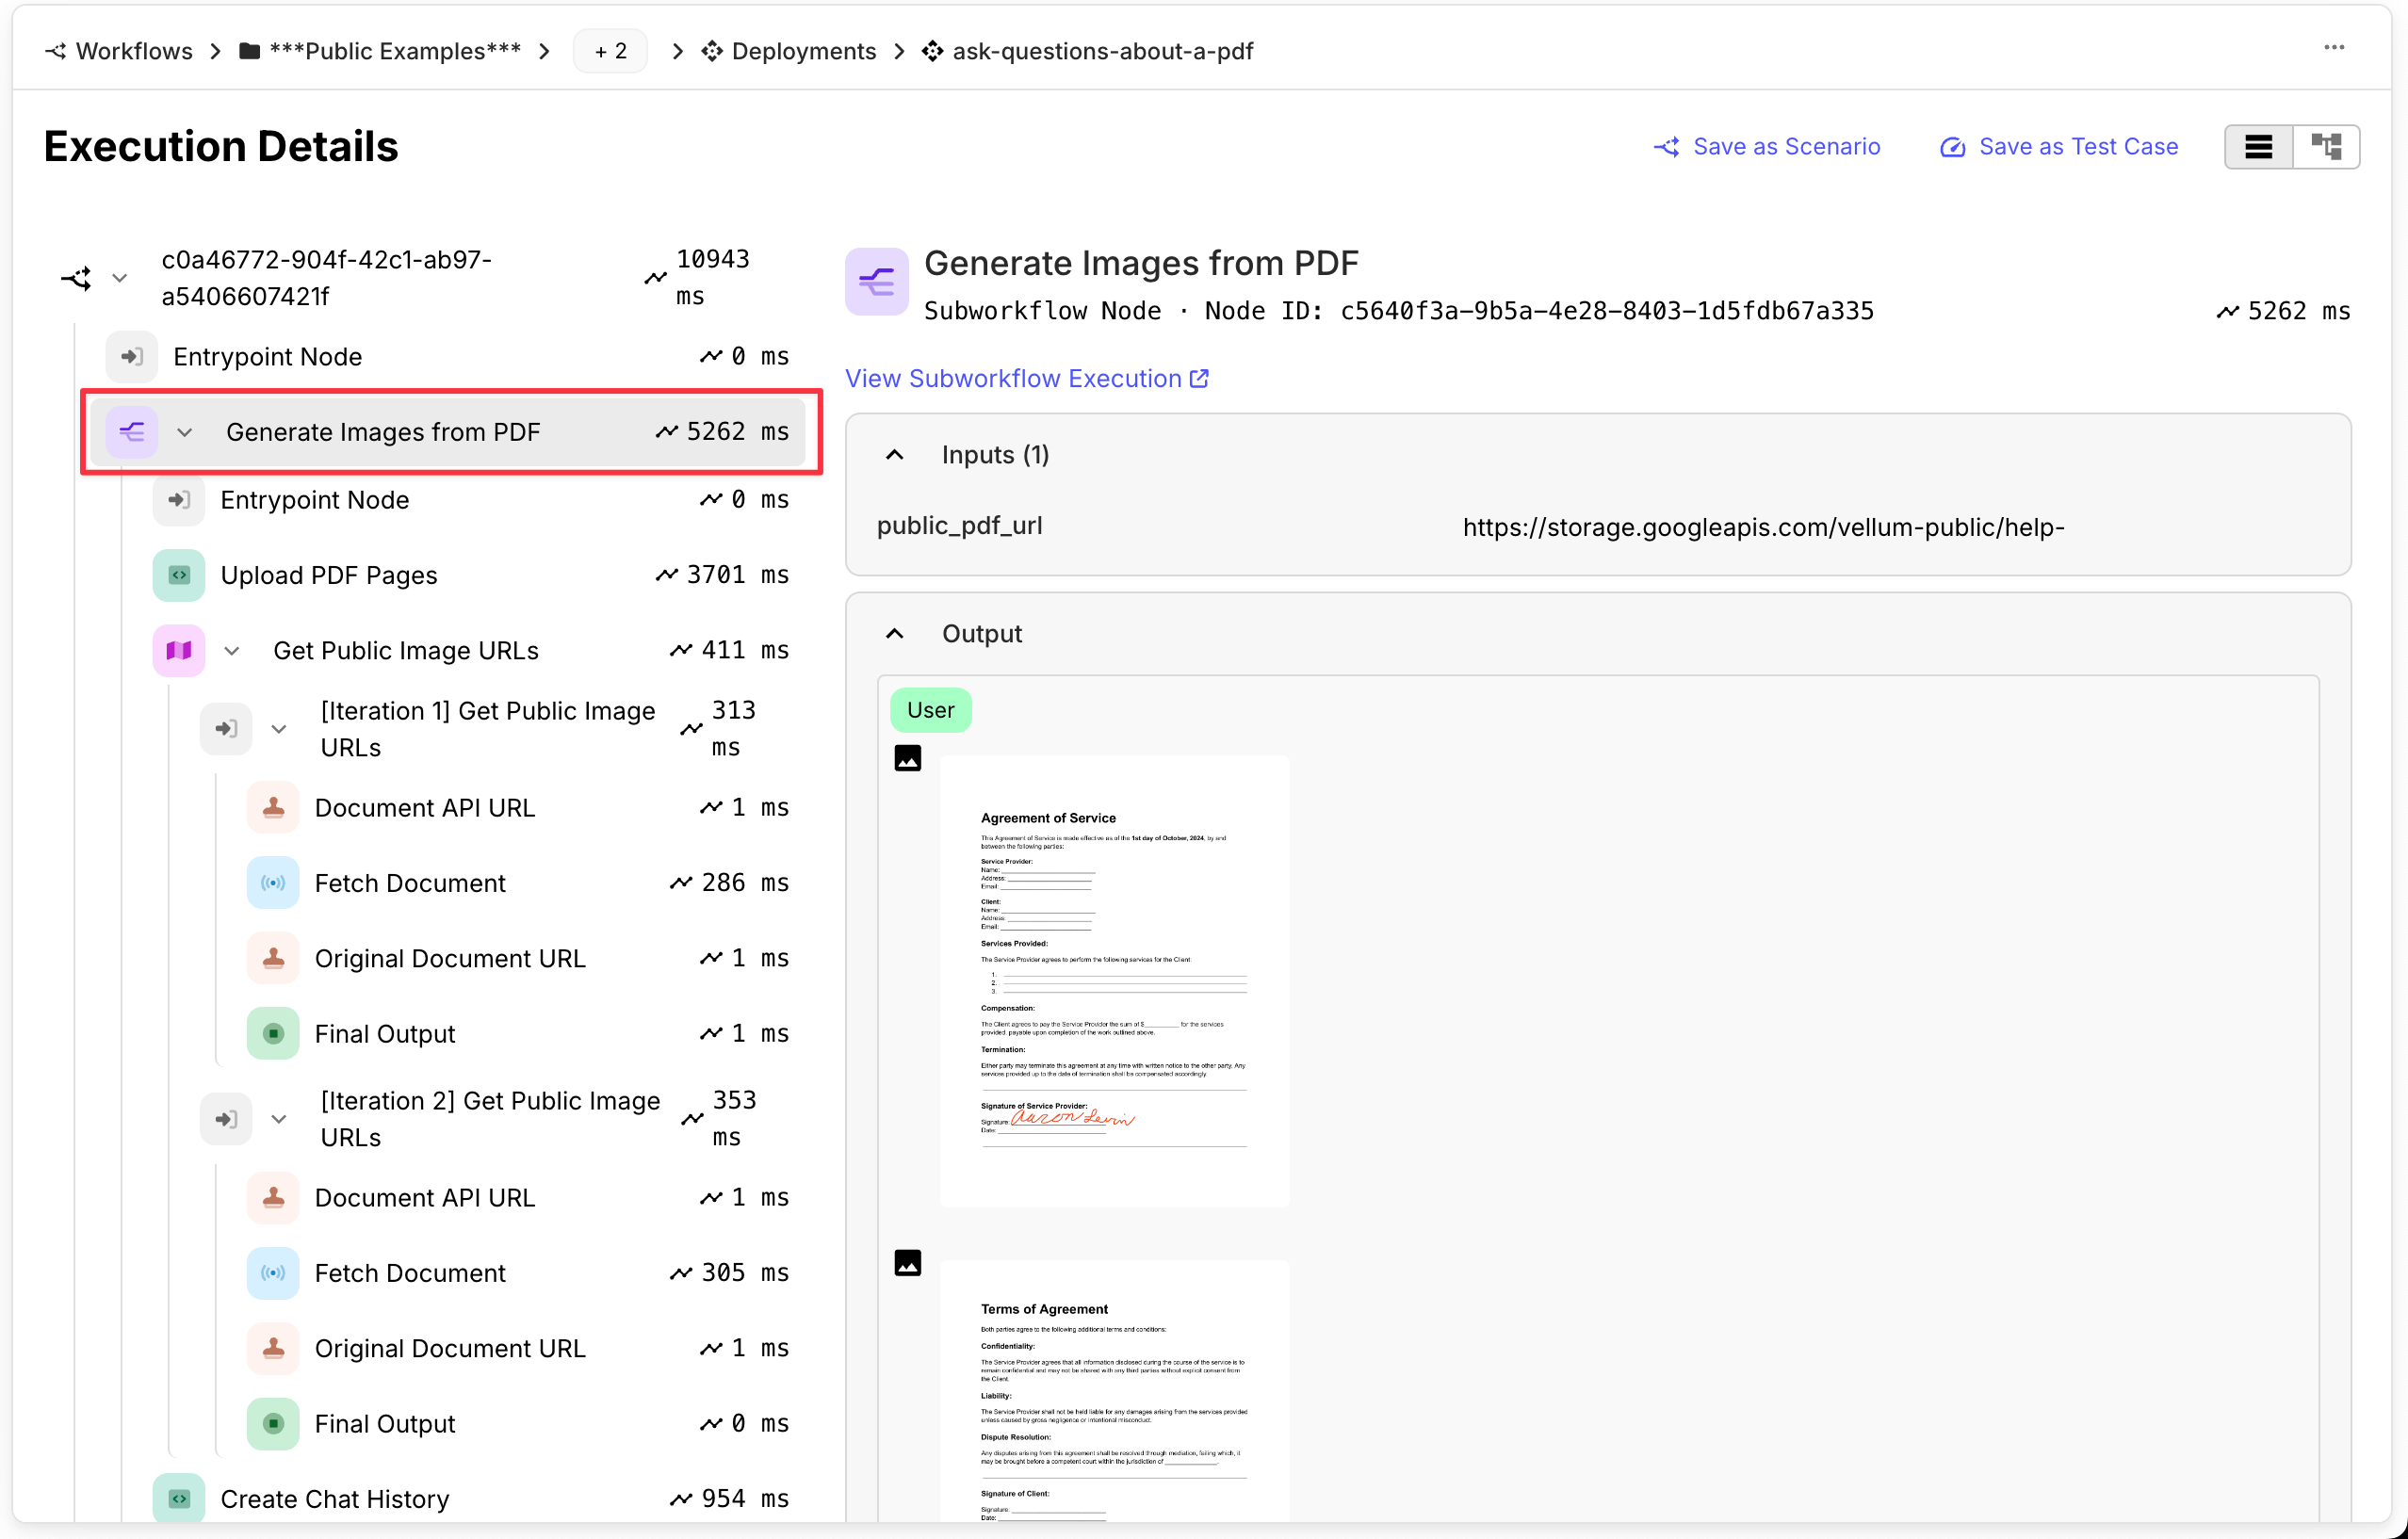
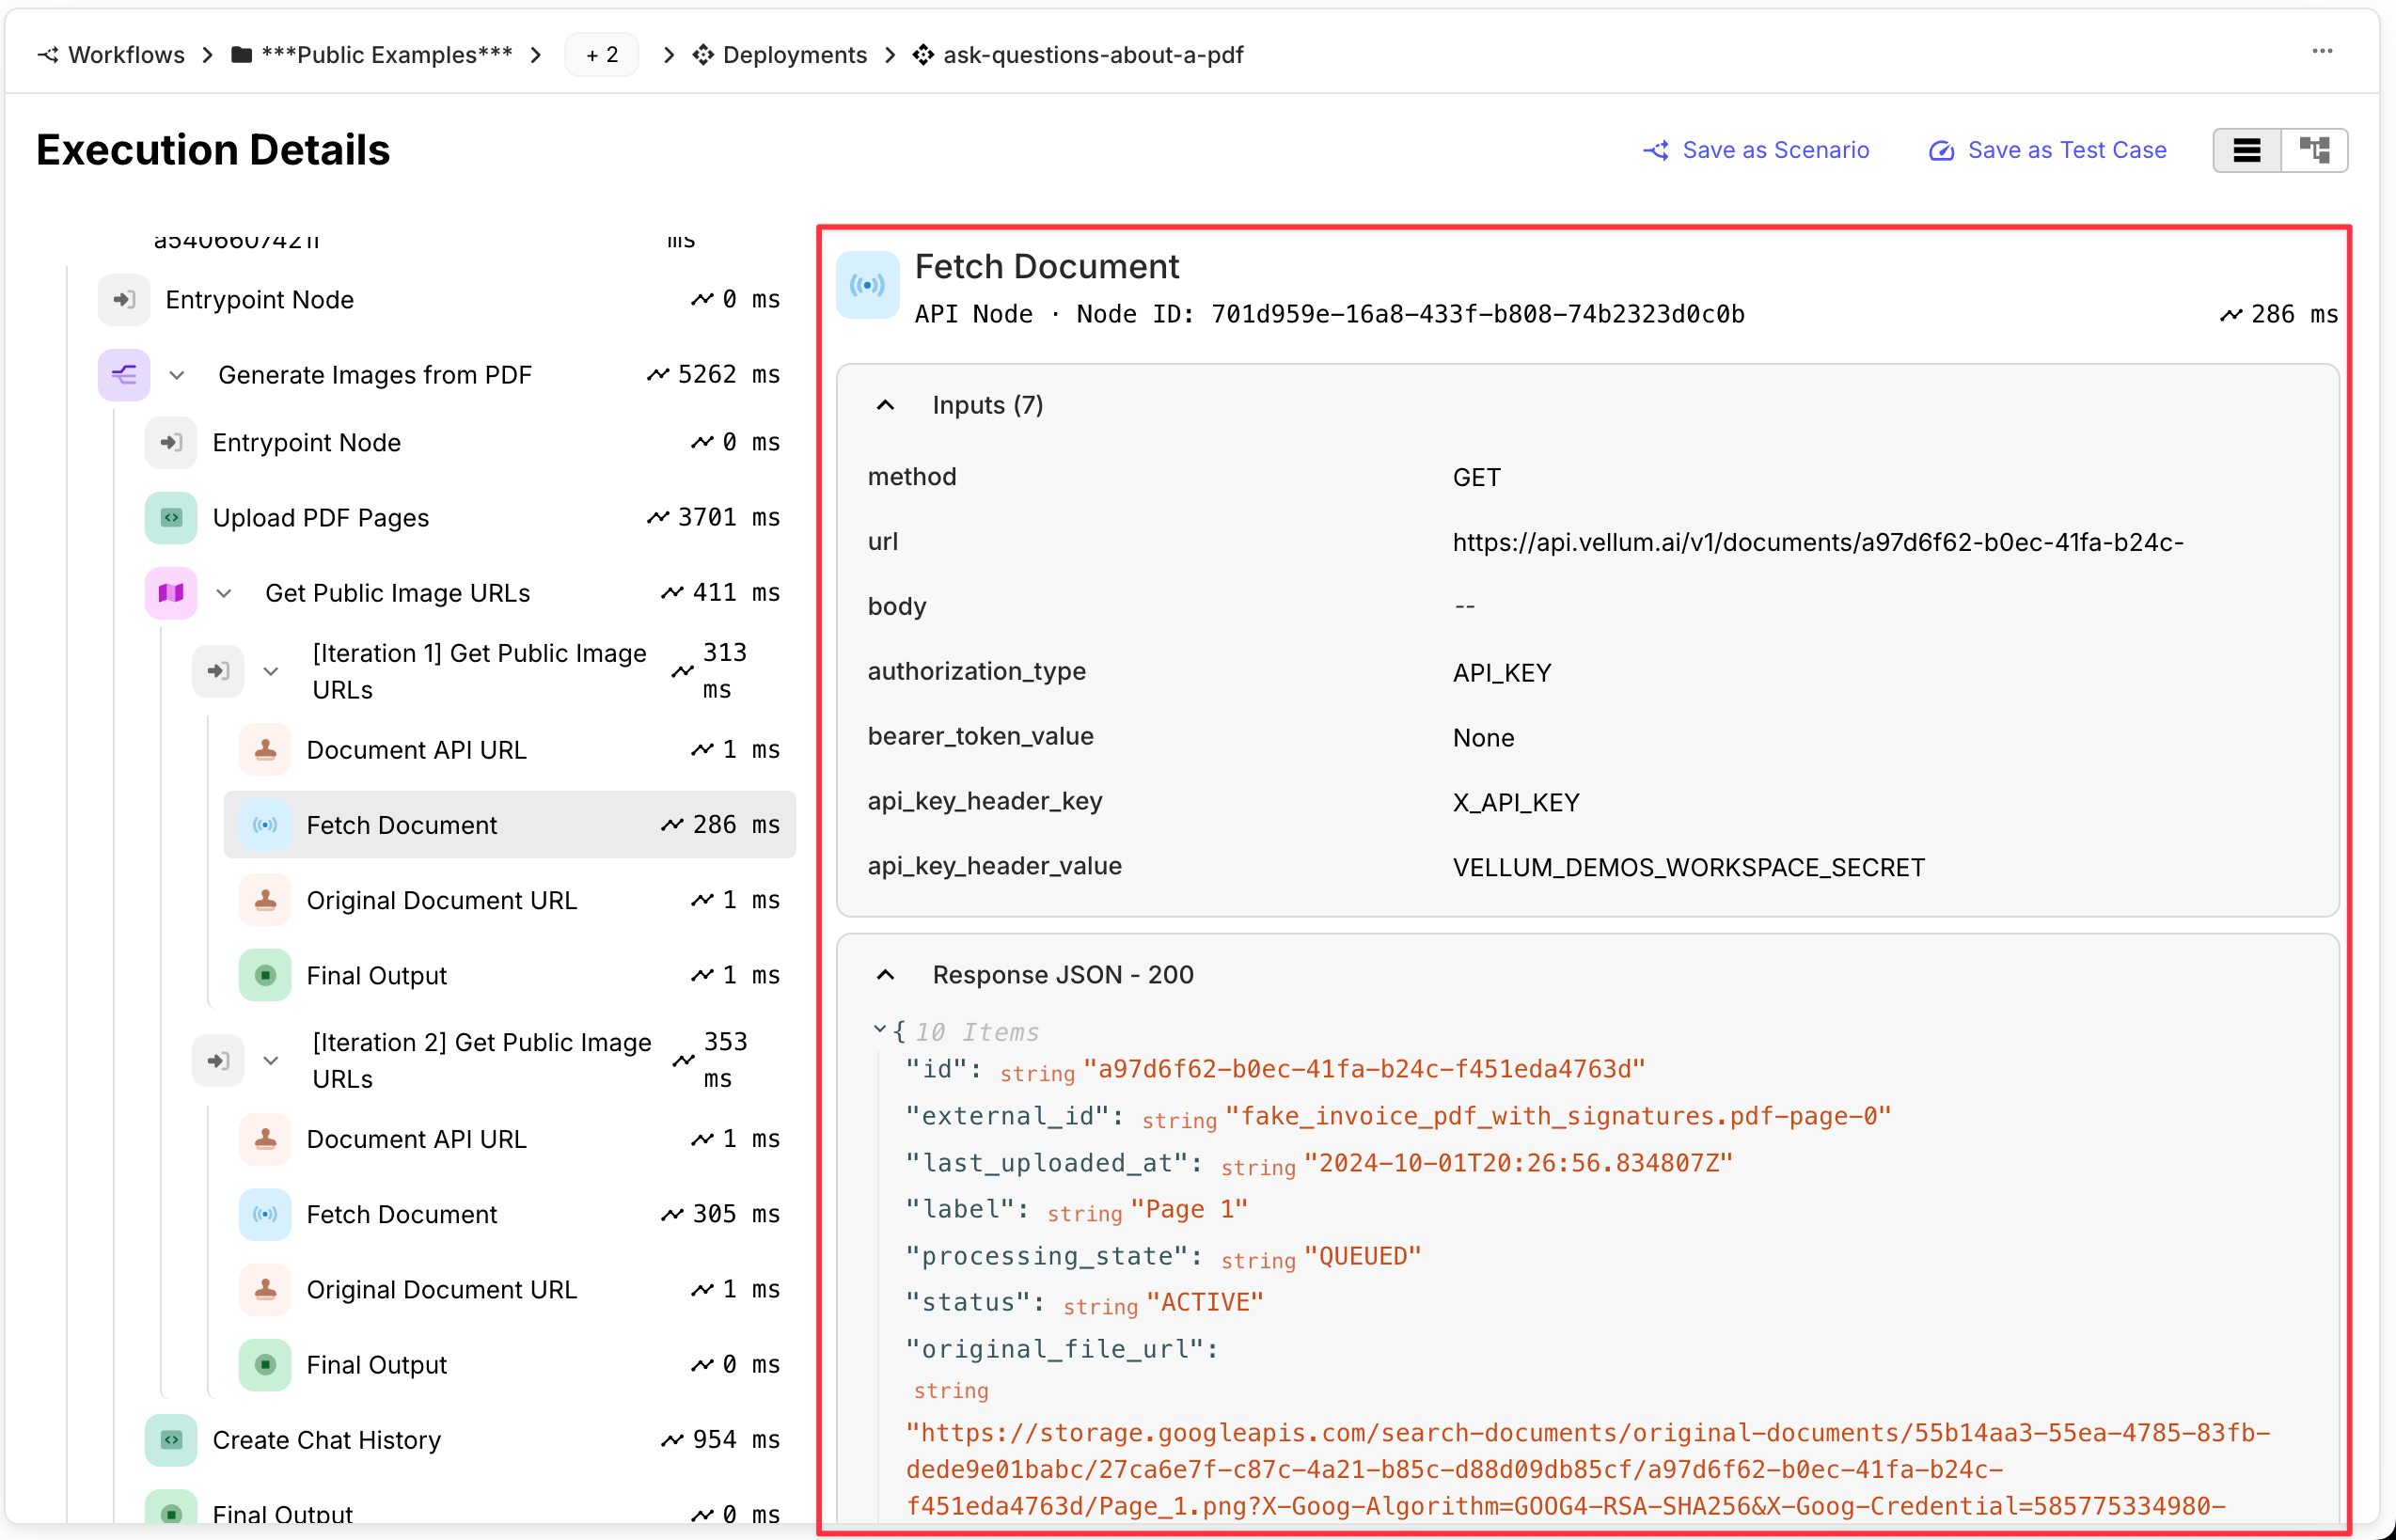
Node Pages : Instead of cluttering the page with the details of all nodes at once, we now display the details for just one node at a time. Click on a node to view its inputs, outputs, and more. Each node even has its own permalink so you can share the url with others.
Improved Map Node Debugging
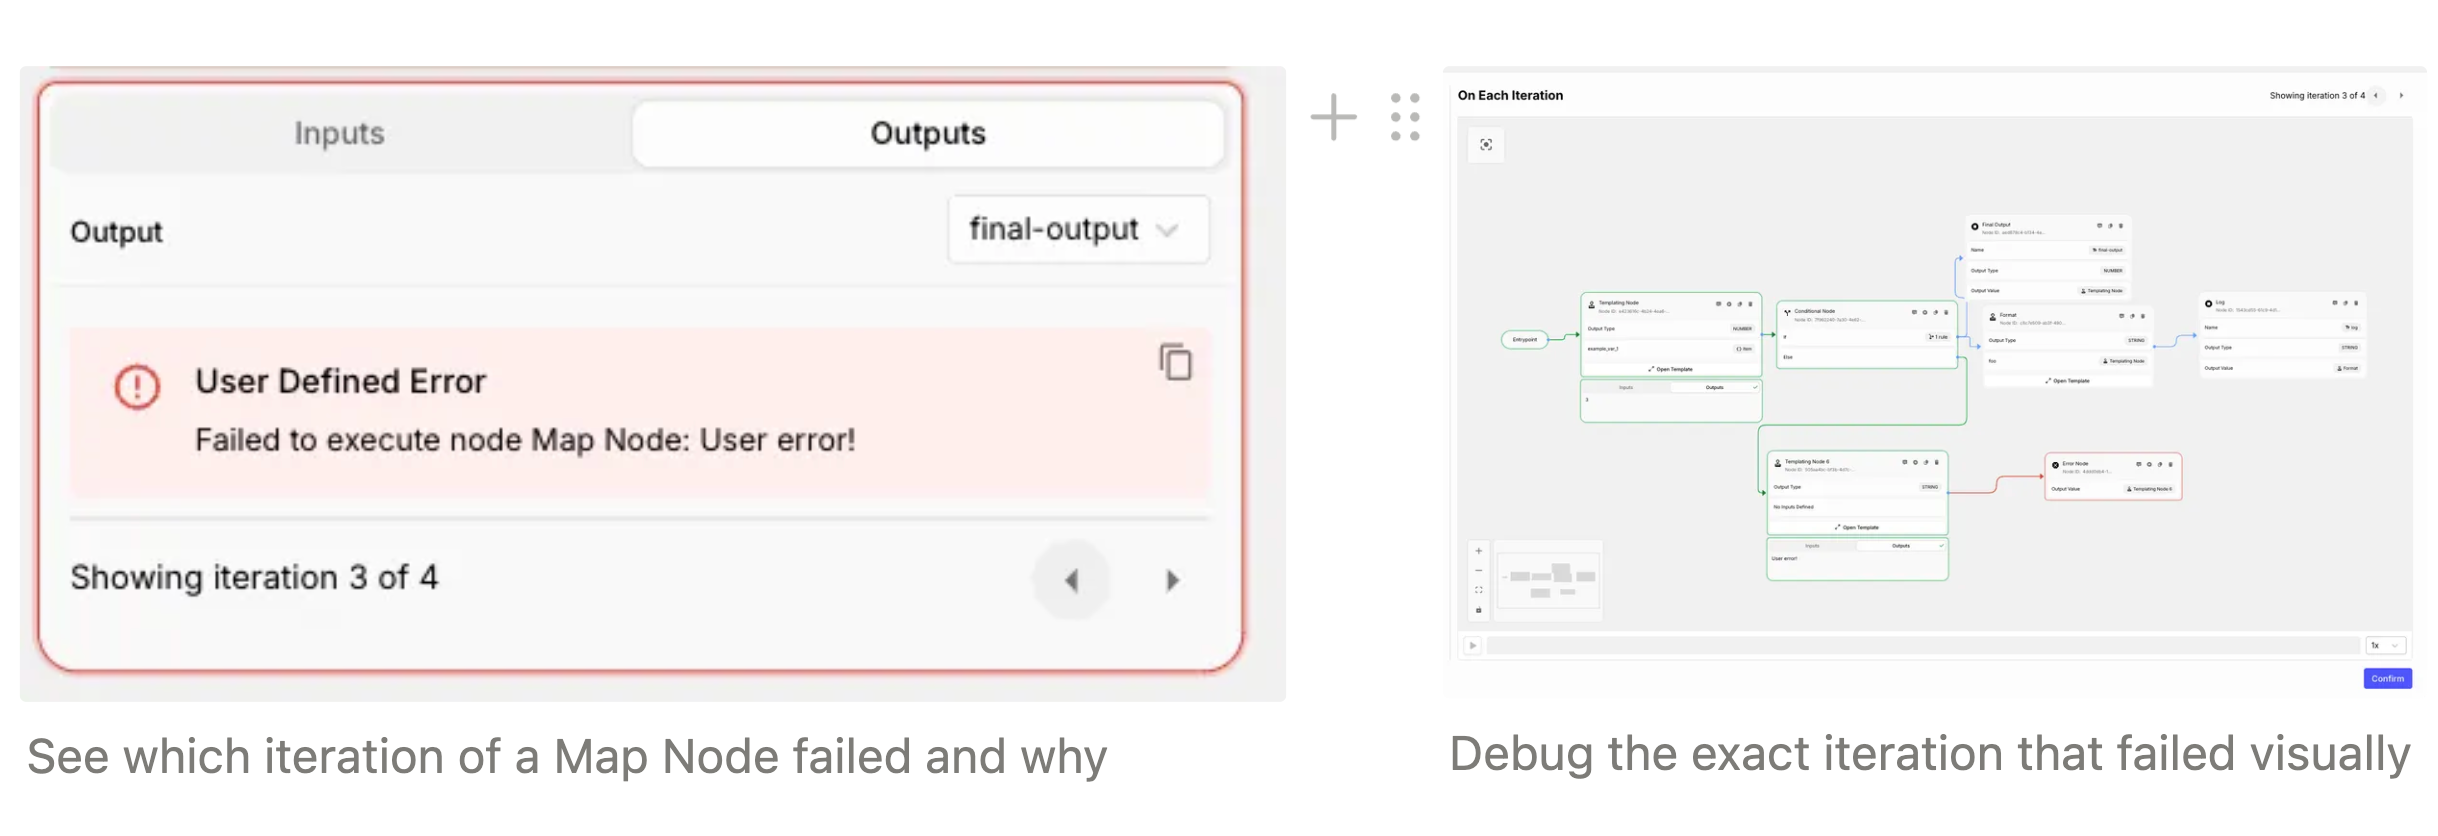
Map Nodes are incredibly powerful— they let you parallelize Workflow executions over any list of objects (up to 96 simultaneously!). However, when errors occur, it used to be difficult to see which iterations failed and why. You’d have to make a change, re-run the entire Map Node, and see if your change fixed the problem.
We now track all iteration executions and make them easy to view right in the Workflow Sandbox! Now, you can page through iterations to see specific error messages and execution paths for each one, spending more time improving your Workflow instead of debugging.
Cost Tracking
We’ve added two new features to make cost tracking easier in Vellum. These will be especially helpful if you want to audit expensive LLM provider calls and optimize your prompts to reduce costs at scale.
These are just a few of many changes we have planned to improve LLM cost visibility in Vellum.
Expand Cost in Execute Prompt APIs
For most folks, seeing costs in Vellums Monitoring UIs is sufficient, but for those API users that want to track outside of Vellum, you can now opt in to receive the cost of a Prompt’s execution in the response of the Execute Prompt and Execute Prompt Stream APIs . This is helpful if you want to store this data in your own systems or display it directly in your product to help your team or customers debug.
Cost Tracking for Prompt Deployment Executions Table
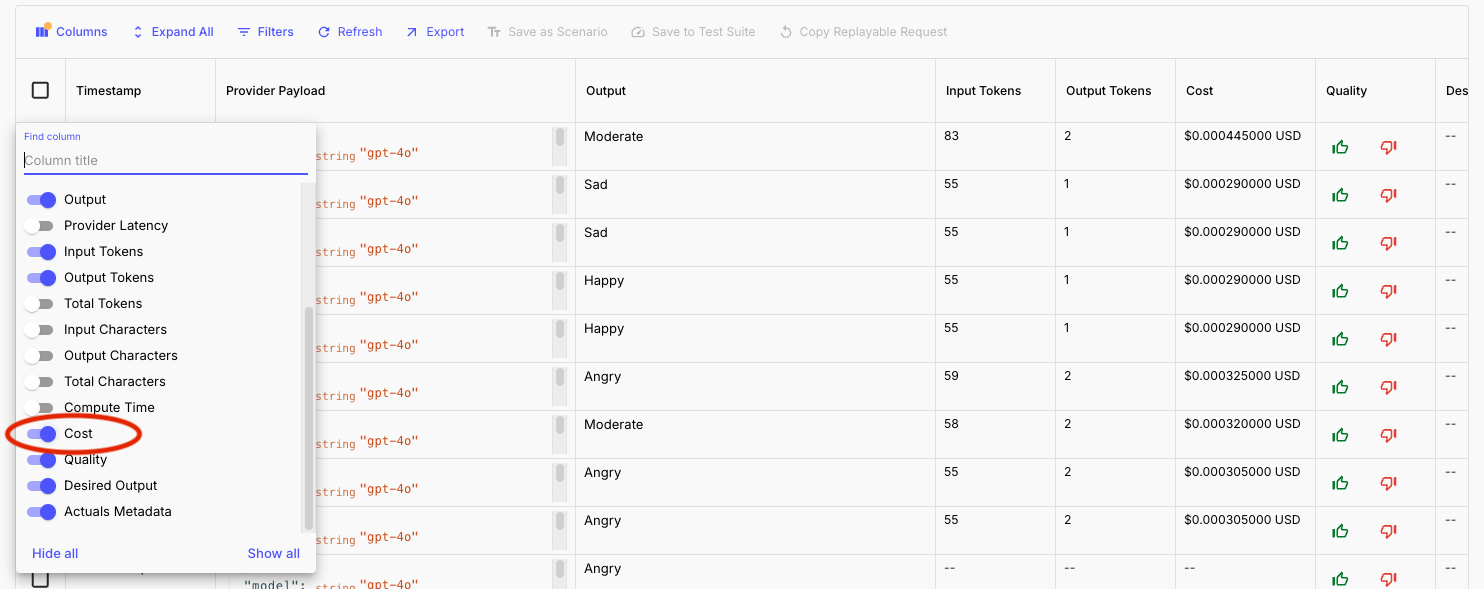
You can now see the cost of each Prompt Execution in the Prompt Executions Table, rather than having to click in one-by-one. This makes it easy to see the cost of a given execution at a glance.
New Models
OpenAI Strawberry (o1) Models
We've added new models o1-preview , o1-mini , o1-preview-2024-09-12 , & o1-mini-2024-09-12 to all workspaces. These models expand your options for leveraging OpenAI's capabilities in your projects.
Google Gemini 1.5 002 Models
Google Gemini’s newest 002 models gemini-1.5-pro-002 & gemini-1.5-flash-002 are now available in Vellum. They offer 50% reduced pricing, 2x higher rate limits, and 3x lower latency than the previous Gemini 1.5 models.
New and Improved Code Editor
We now use Monaco Editor for our code editor that is used by Workflow Code Nodes and custom Code Evaluation Metrics. Monaco is the same editor that Visual Studio Code uses under the hood.
This offers a number of improvements including IntelliSense, semantic validation and syntax validation. Additionally we now inject Vellum Value types into the editor, so you can now have fully typed input values for things such as Chat History. Some of these improvements are currently only available for TypeScript and not Python.
Collaboration
Workflow & Prompt Development
We’ve made it significantly easier to collaborate on Workflows and Prompts in realtime with your teammates.
It used to be that when two people were on the same Prompt / Workflow Sandbox, only one person could edit and interact with the page. If you were a Viewer, you were unable to interact with the page at all and were blocked with a big page overlay.
Now, the page overlay is gone. Viewers can interact with the page in a read-only mode and perform actions that don’t affect the state of the page. This includes things like scrolling, opening modals, reviewing Prompts, copying text, etc.
Learn from The Pros with Interactive Previews in Help Docs
We’ve improved our Interactive Workflows in our Help Docs! Now, you can learn from expert Prompt Engineers by opening Prompt Nodes to see the exact prompts we’re using in our example Workflows.
Check out our Examples and Walkthroughs page for a few samples. Below is a new one while you’re here— it extracts signatures (and fields that are supposed to be signed) from a PDF. It does this by fetching a PDF from a URL, calling a Subworkflow to convert the pages into images, then inputs them to a Prompt Node, using multimodality to find and extract signatures.
You can now click into Prompt Nodes to view Prompts in any Vellum Embedded Workflow Previous:
Deployment Executions Table Updates
Prompt Deployment Executions Table
Improved Load Times
Filters and sorts are faster… much faster. In some instances, load times have dropped from 2 minutes to a few seconds.
Release Tag Column and Filter
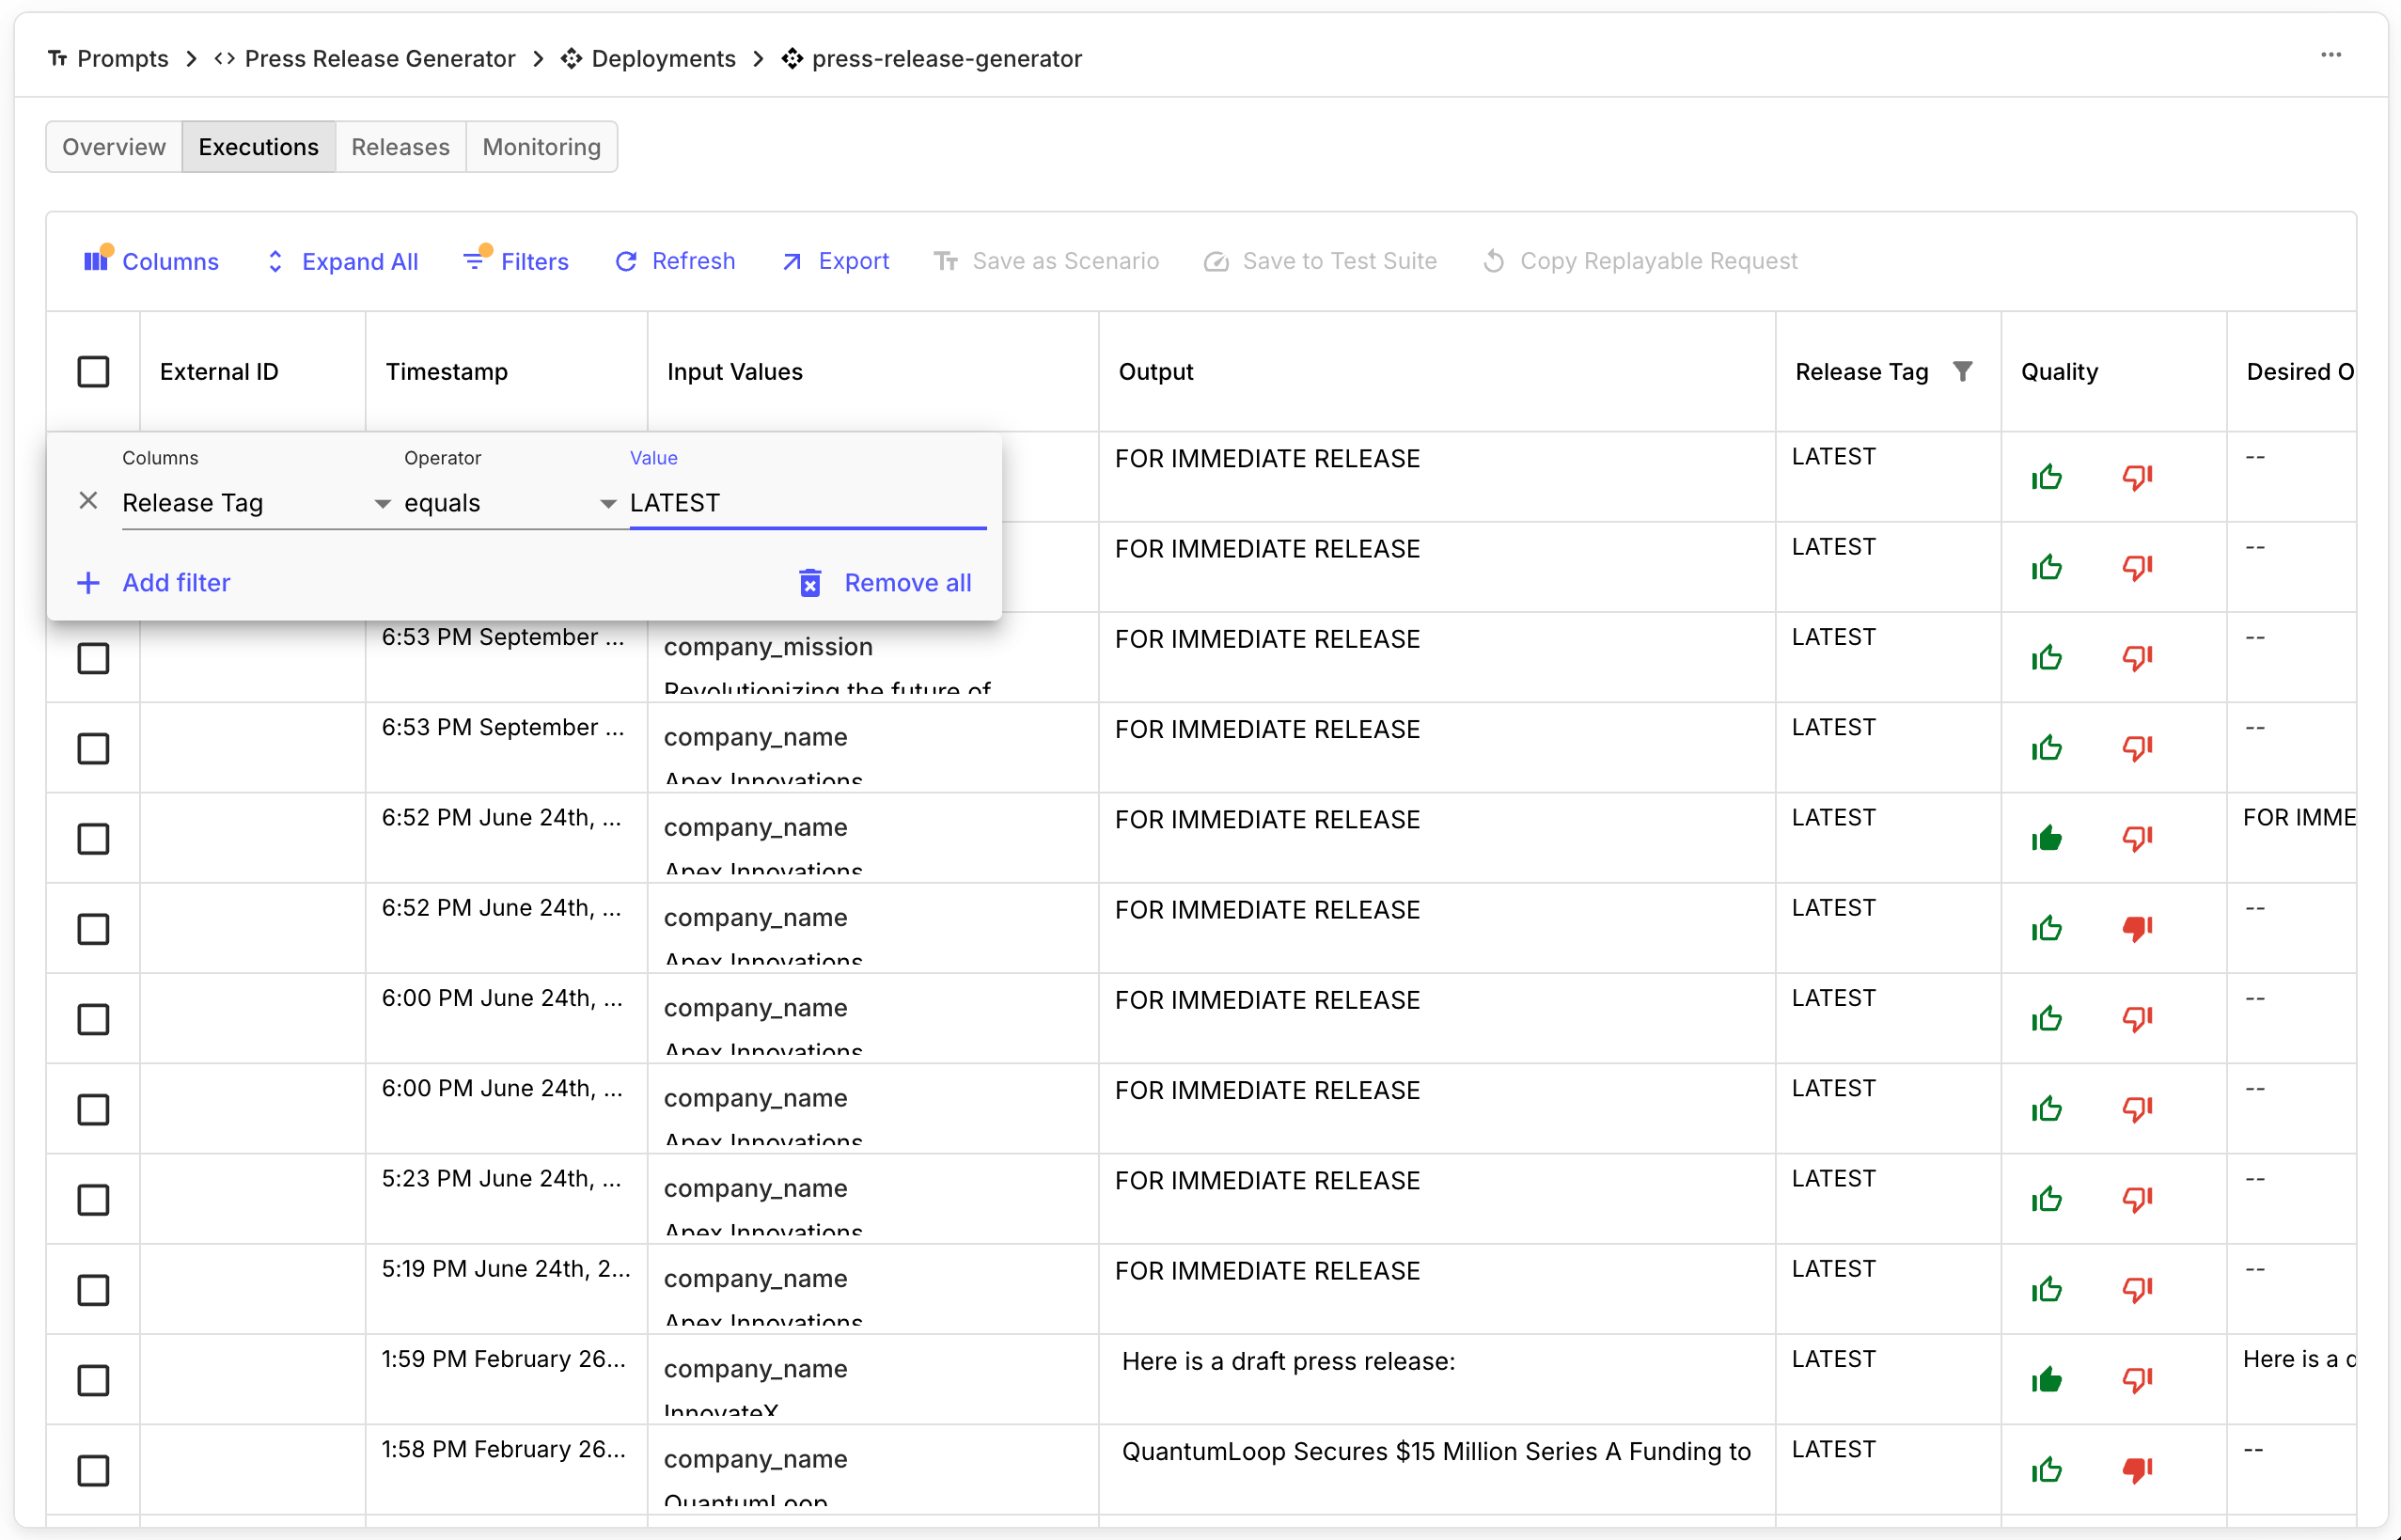
You can now view and filter on Release Tags attached to your Prompt Executions within the Prompt Deployment Execution Table! This allows for quick identification of the Release Version associated with each Execution. You can enable this new column in the Columns dropdown.
New Prompt Caching Columns
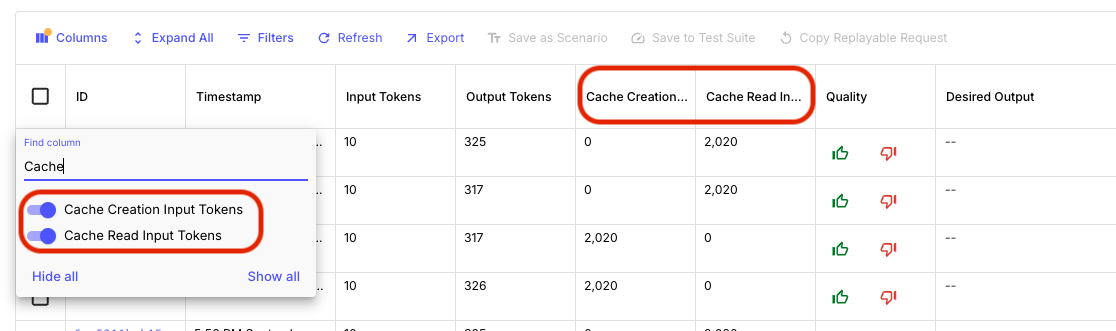
A while back Anthropic added support for Prompt Caching . With this update, you’ll now see the number of Prompt Cache Read and Cache Creation Tokens used by a Prompt Deployment’s executions if it’s backed by an Anthropic model. This new monitoring data can be used to help analyze your cache hit rate with Anthropic and optimize your LLM spend.
Workflow Deployment Executions Table
Latency Filtering and Sorting for Workflow Executions
Want to optimize your End User Experience by making your Workflows run 10x faster? But having trouble finding example Scenarios to test with? Look no further!
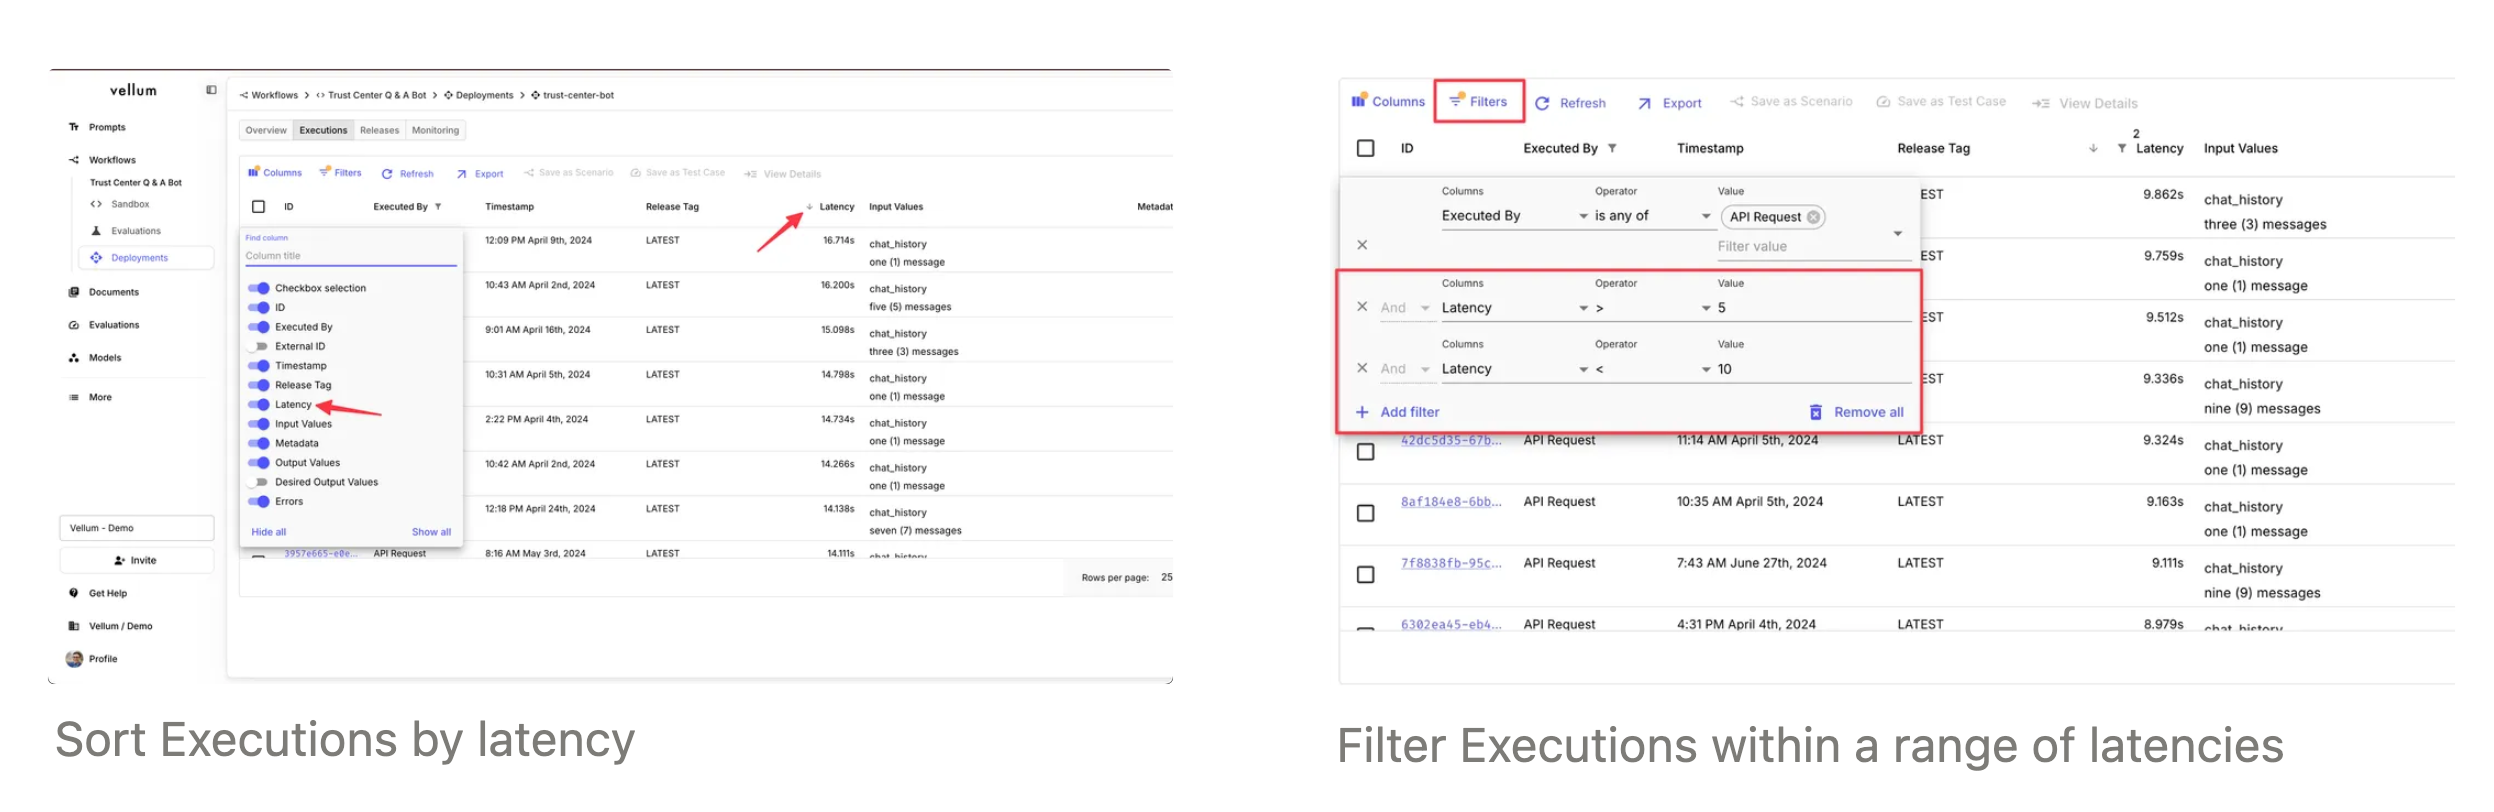
You can now sort and filter by the Latency field in the Workflow Executions Table! This update allows for better prioritization and identification of executions with higher or lower latencies, as well as targeting executions within a range of latencies. We believe these improvements will greatly aid in monitoring and managing workflow executions and their performance and metrics.
External ID Filtering for Workflow Deployment Executions
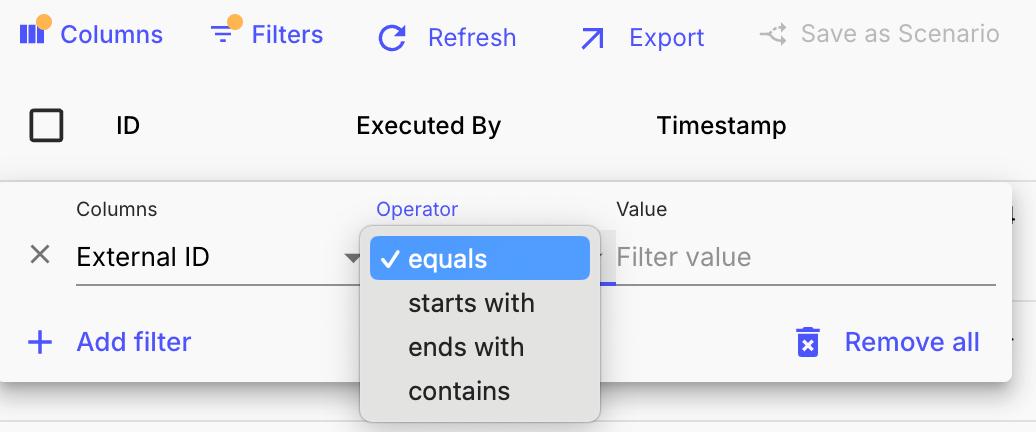
Previously, when filtering Workflow Deployment Executions by External IDs, you had to provide the exact string match to retrieve relevant results.
Now, you can filter External IDs using a variety of string patterns. You can specify that the External ID should start with, end with, or contain substrings. This allows for more flexible filtering, making it easier to locate specific Workflow Deployment Executions based on partial matches.
Other Workflow Updates
Resizable Node Editor Panel
For those of you using the new Workflow Builder , you’ll now be able to resize the Node Editor Panel. This update makes it easier to edit complex Conditional Node rules, Chat History Messages, JSON values, and more.
Quality of Life Improvements
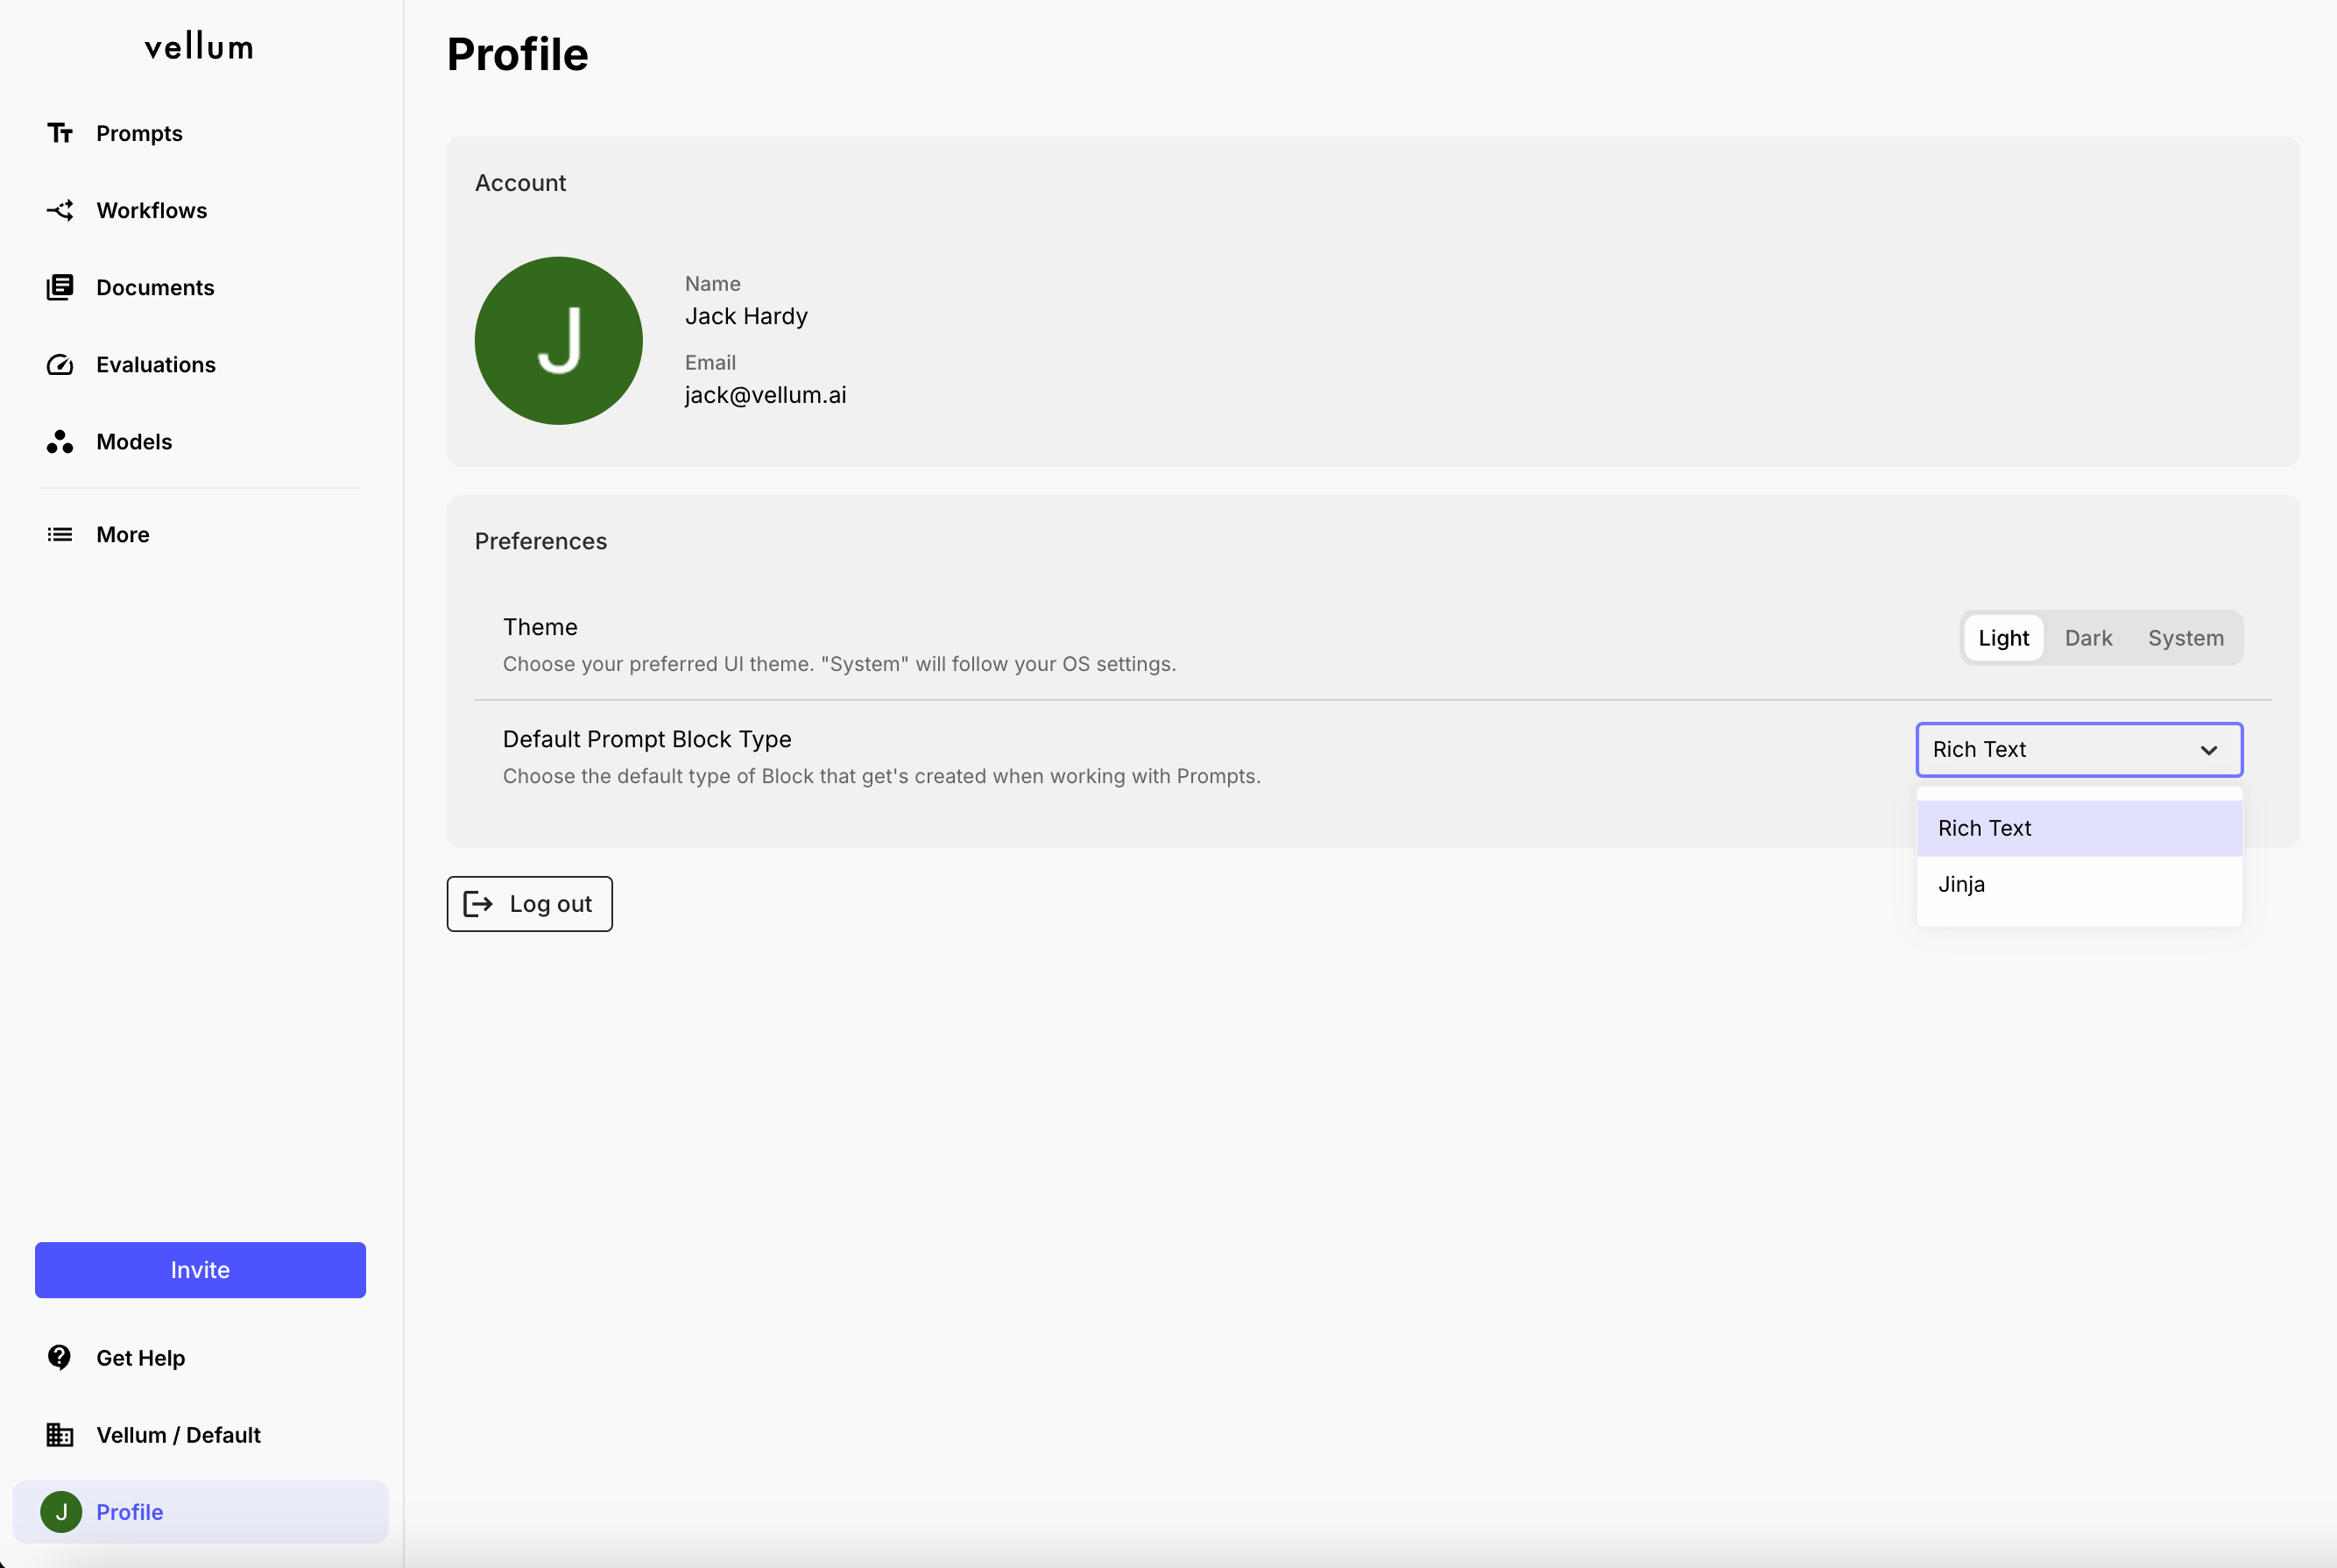
Default Block Type Preference
You can now set a default Block type to use when defining Prompts in Vellum. Whenever you see the “Add Block” or “Add Message” options in a Prompt Editor, your preferred Block type will be used.
By default, the Block type is set to “Rich Text,” the newer option that supports Variable Chips. You can still switch between Block types for individual Blocks within the Prompt Editor.
Evaluations Performance Improvements
While not as flashy as some of our other updates, we’ve undergone a major overhaul of our Evaluations backend resulting in significant performance improvements to the Evaluations page. Test Suites consisting of thousands of Test Cases used to feel sluggish and sometimes not load, but now load successfully and should feel much more responsive.
VPC Disable gVisor Option for Code Execution
gVisor is needed for secure sandboxing in our Managed SASS platform, but in a self hosted environment where you’re the only organization, it’s not strictly required if you trust that users within your org won’t run malicious code.
VPC customers of Vellum can now disable gVisor sandboxing for code execution in self-hosted environments to significantly improve the performance of Code Nodes in Workflows.
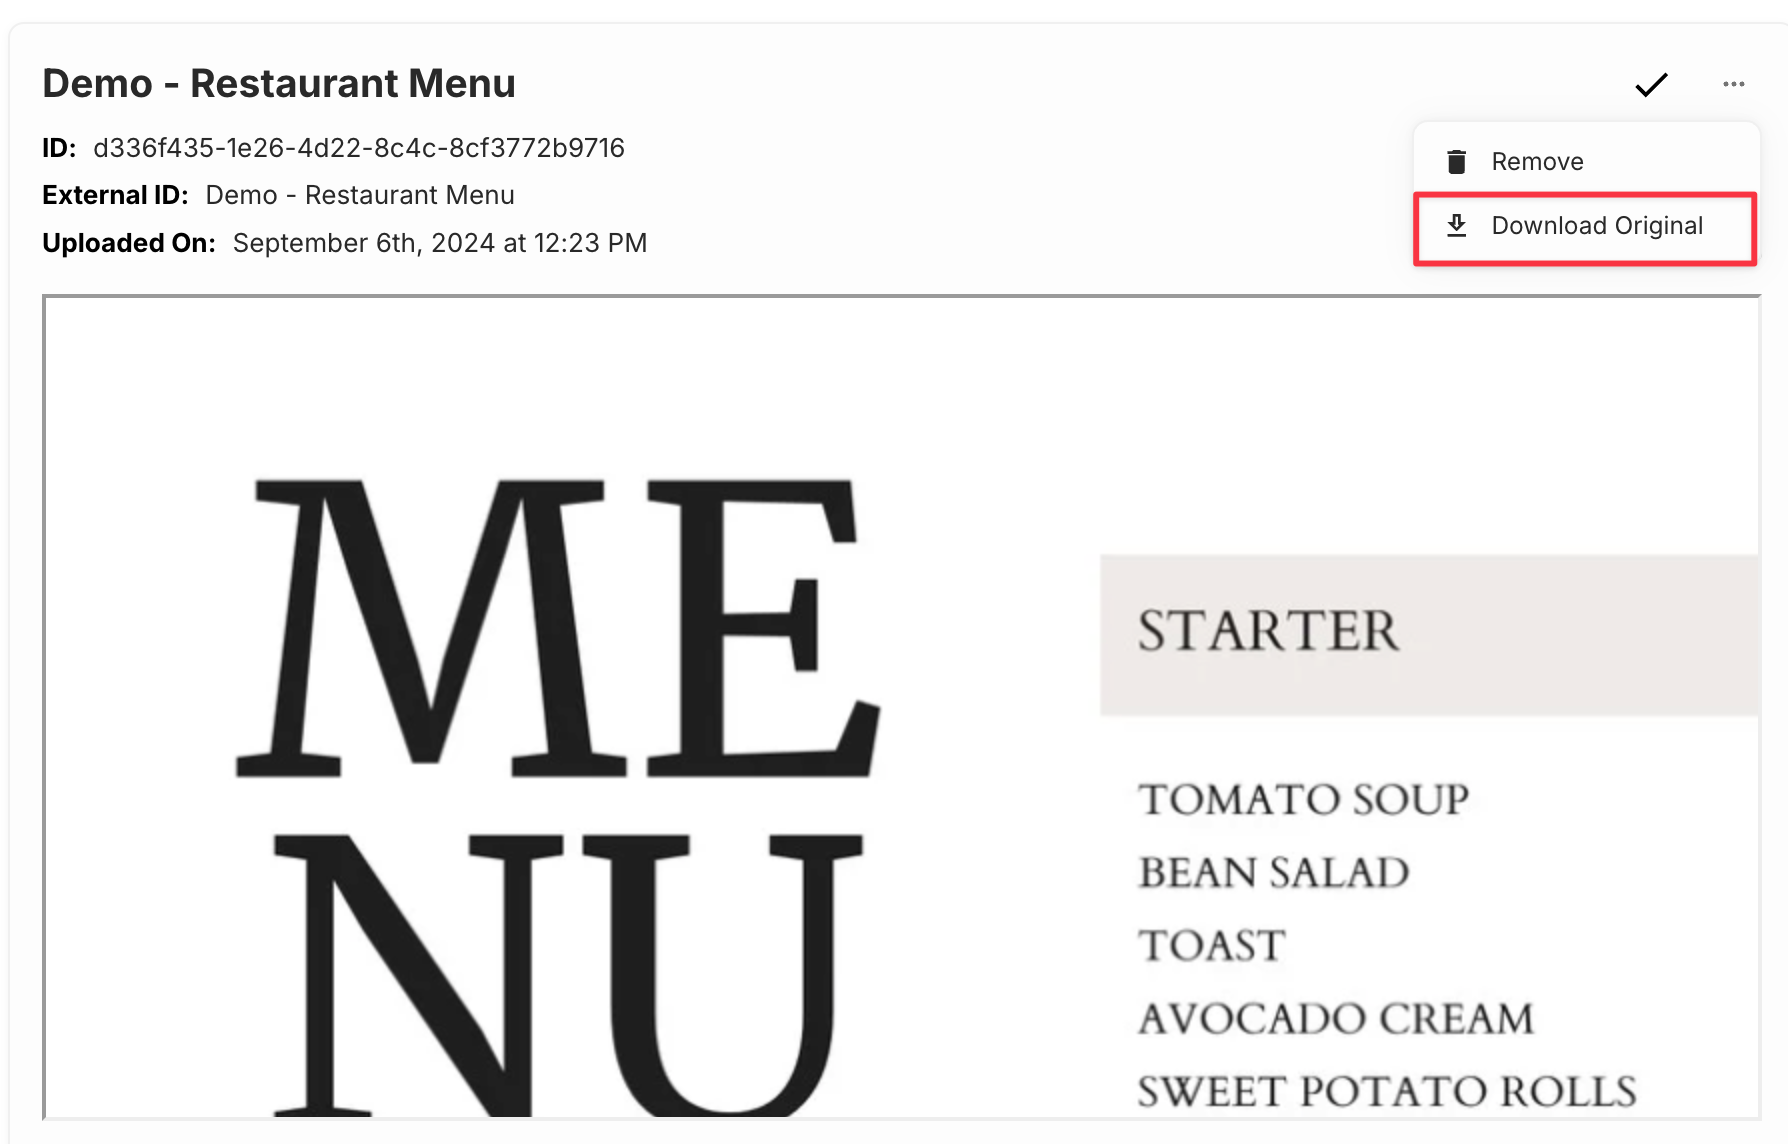
Download Original Document from UI
You can now download a file that was originally uploaded as a Document to a Document Index from the UI. You’ll find a new “Download Original” option in a Document’s ••• More Menu.
See you in November!
September has been one for the books!
We can’t wait to see how you’ll use these new features to improve your products. Stay tuned for more changes next month — and sign up for our newsletter to get these updates in your inbox!


